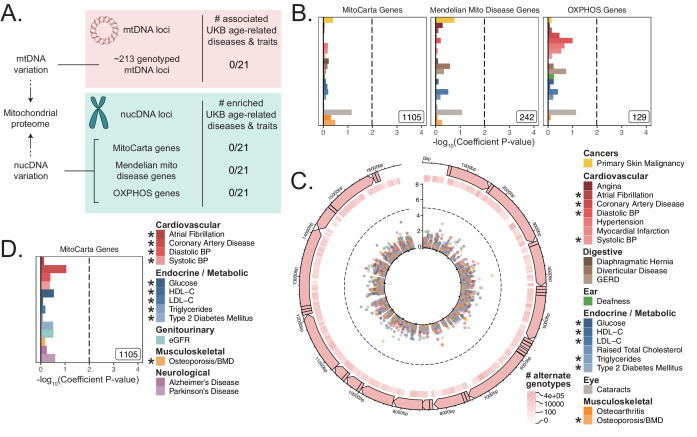
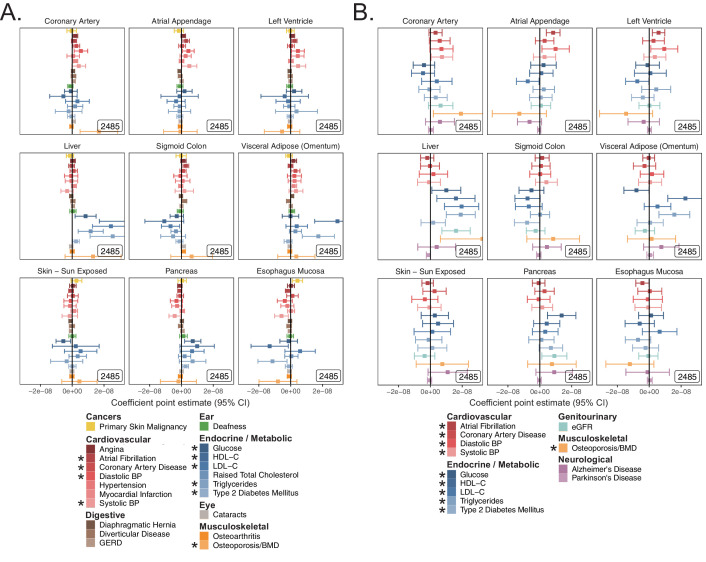
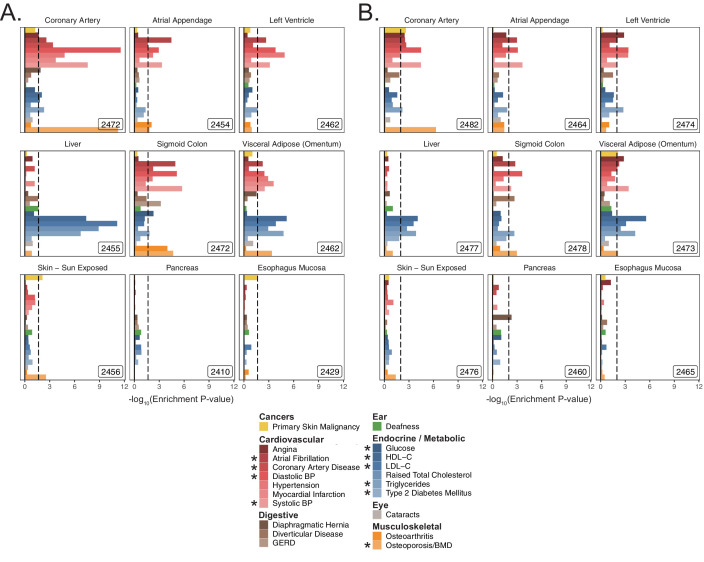
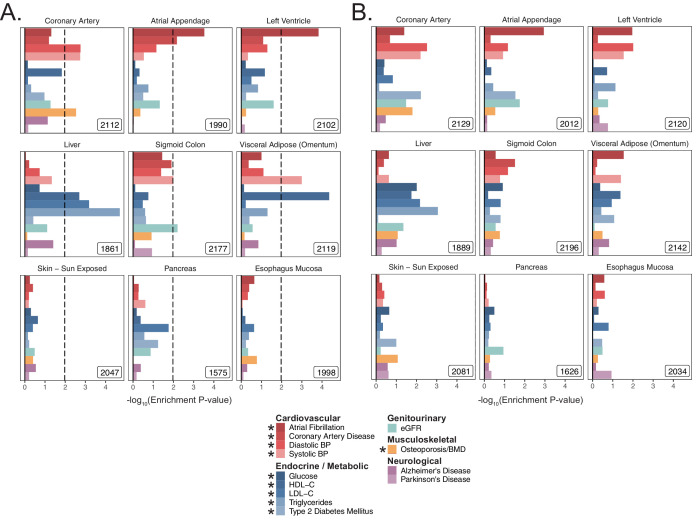
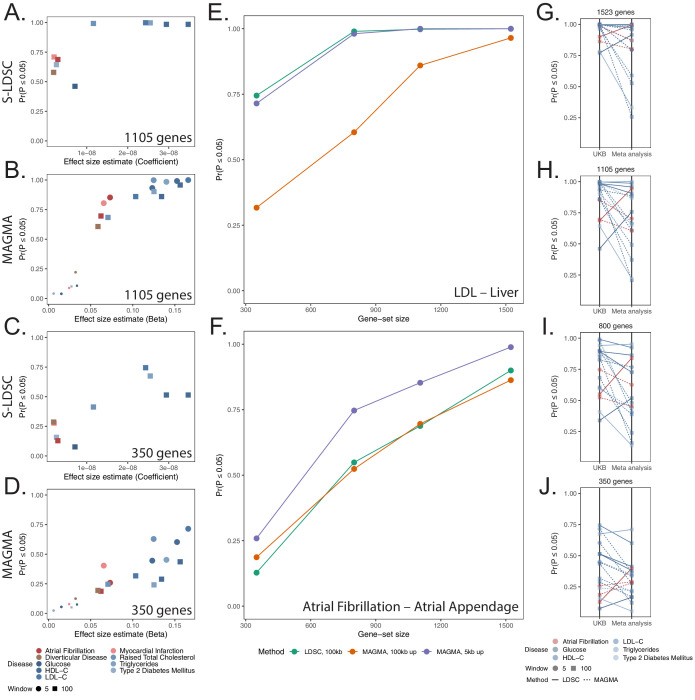
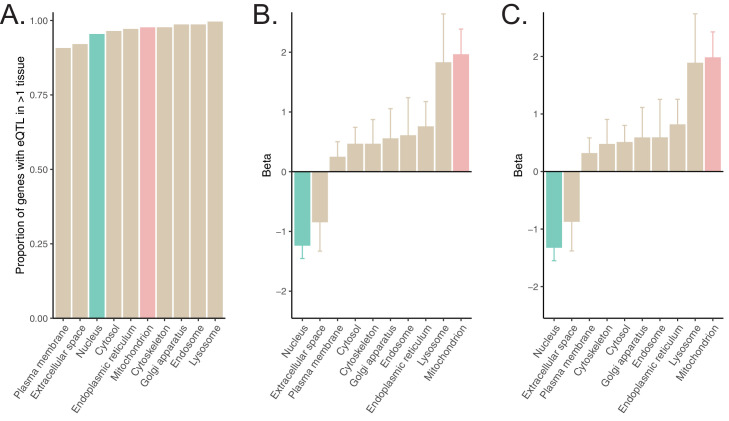
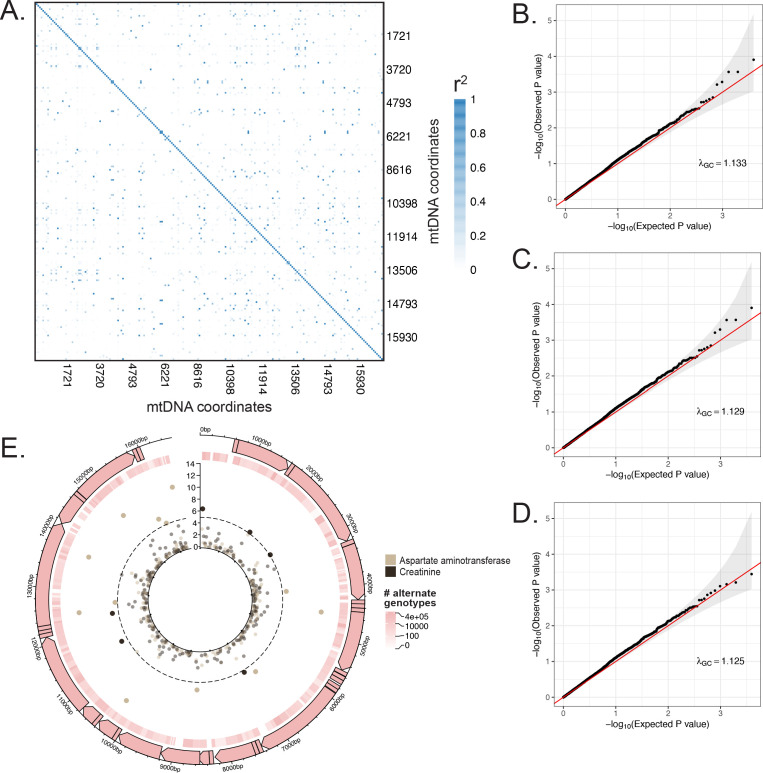
Figure 2. Assessment of the association of nucDNA and mtDNA loci contributing to the mitochondrial proteome with age-related traits.
(A) Scheme outlining the aspects of mitochondrial function assessed in this study. nucDNA loci contributing to the mitochondrial proteome are shown in teal, while mtDNA loci are shown in pink. (B) S-LDSC enrichment p-values on top of the baseline model in UKB. Inset labels represent gene-set size; dotted line represents BH FDR 0.1 threshold. (C) Visualization of mtDNA variants and associations with age-related diseases. The outer-most track represents the genetic architecture of the circular mtDNA. The heatmap track represents the log-scaled number of individuals with an alternate genotype at each site. The inner track represents mitochondrial genome-wide association p-values, with radial angle corresponding to position on the mtDNA and magnitude representing –log10 p-value. Dotted line represents Bonferroni cutoff for all tested trait-variant pairs. (D) Replication of S-LDSC enrichment results in meta-analyses. Dotted line represents BH FDR 0.1 threshold. * represents traits for which sufficiently well-powered cohorts from both UKB and meta-analyses were available. The trait color legend to the right of panel (C) applies to panels (B) and (C), representing UKB traits. S-LDSC enrichment p-values plotted in (B) and (D) are available in Source data 1; mtDNA-GWAS summary statistics are available in Source data 2.

