. 2021 Sep 1;10:e68610. doi: 10.7554/eLife.68610

Figure 5. Differences in constraint distribution across organelles.

(A) Constraint as measured by LOEUF from gnomAD v2.1.1 for genes comprising organellar proteomes, book-ended by distributions for known haploinsufficient genes as well as olfactory receptors. Lower values indicate genes exacting a greater organismal fitness cost from a heterozygous LoF variant (greater constraint). (B) Proportion of each gene-set found in the lowest LOEUF decile. Higher values indicate gene-sets containing more highly constrained genes. (C) Constraint distributions for subsets of the nuclear-encoded mitochondrial proteome (red) and subsets of the nucleus (teal). Black points represent the mean with 95% CI. Inset numbers represent gene-set size.

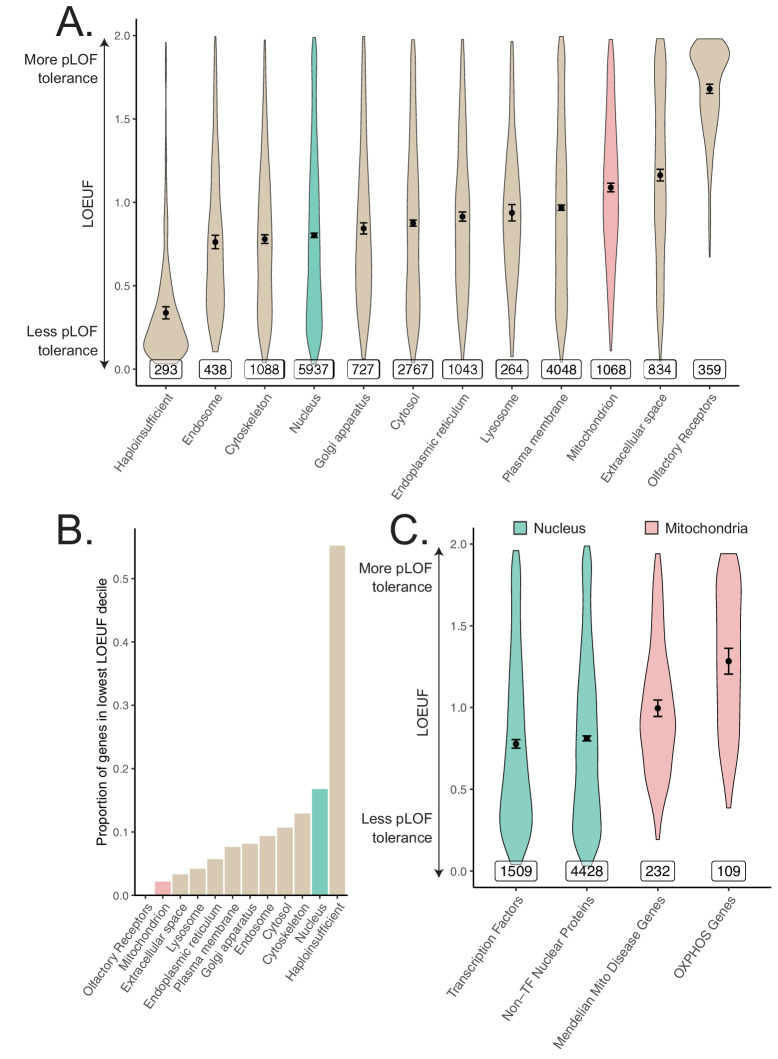
Figure 5.

Figure 5—figure supplement 1. Constraint distributions within subdivisions of the nuclear proteome.

Figure 5—figure supplement 1.

(A) Constraint distributions for spatially defined subsets of the nuclear proteome. Gene-sets used are identical to those tested in Figure 3C. (B) Constraint distributions for transcription factor DNA-binding domains. Gene-sets used are identical to those tested in Figure 3—figure supplement 5. Black points represent the mean with 95% CI. Inset numbers represent gene-set size.
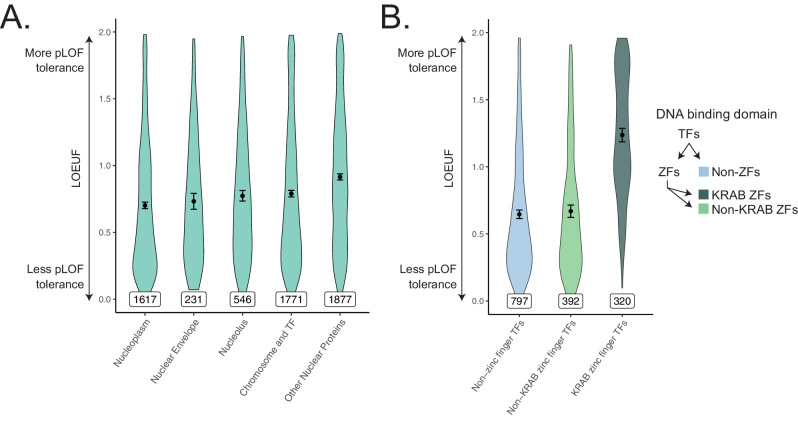
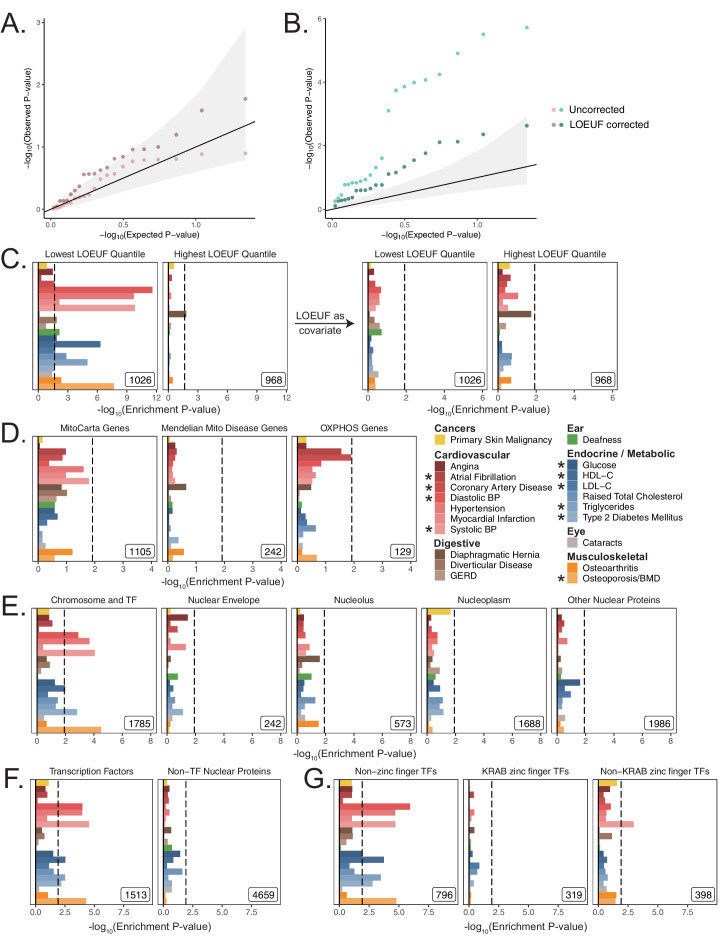
Figure 5—figure supplement 2. Enrichment results across age-related disease in UKB after correcting for constraint using MAGMA with a 5 kb up, 1.5 kb down window.

Figure 5—figure supplement 2.

Quantile-quantile plots showing enrichment across age-associated disease in UKB for (A) mitochondria-localizing and (B) nucleus-localizing genes before and after correction for constraint. The central black line represents null p-values following the uniform distribution and the shaded ribbon represents 95% CI. (C) Enrichment p-values for genes with the lowest and highest LOEUF before and after inclusion of constraint as a covariate in the MAGMA model. (D) Enrichment p-values for mitochondria-localizing genes. (E) Enrichment p-values for spatial subsets of the nuclear proteome and (F) for subsets of the Chromosome and TF category. (G) Enrichment p-values for TFs subdivided by DNA-binding domain. Inset numbers represent gene-set size, black lines are cutoff at BH FDR < 10%.
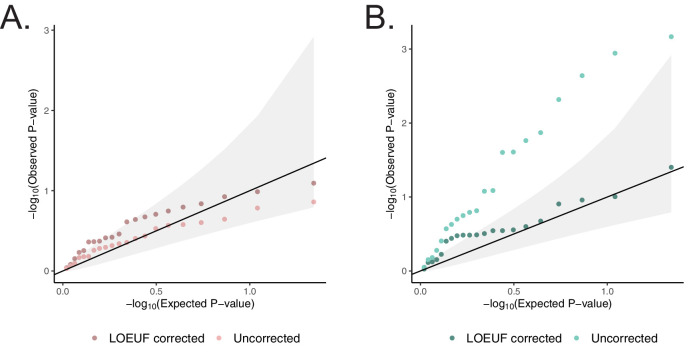
Figure 5—figure supplement 3. Enrichment results across age-related disease in UKB after correcting for gene constraint using MAGMA with a 100 kb symmetric gene window.

Figure 5—figure supplement 3.

(A) Quantile-quantile plot highlighting enrichment results for mitochondria-localizing genes across age-associated diseases in UKB before and after correcting for constraint. (B) Quantile-quantile plot highlighting enrichment results for genes comprising the nuclear proteome across age-associated diseases in UKB before and after correcting for constraint. The central black line represents expected null p-values following the uniform distribution and the shaded ribbon represents 95% CI.