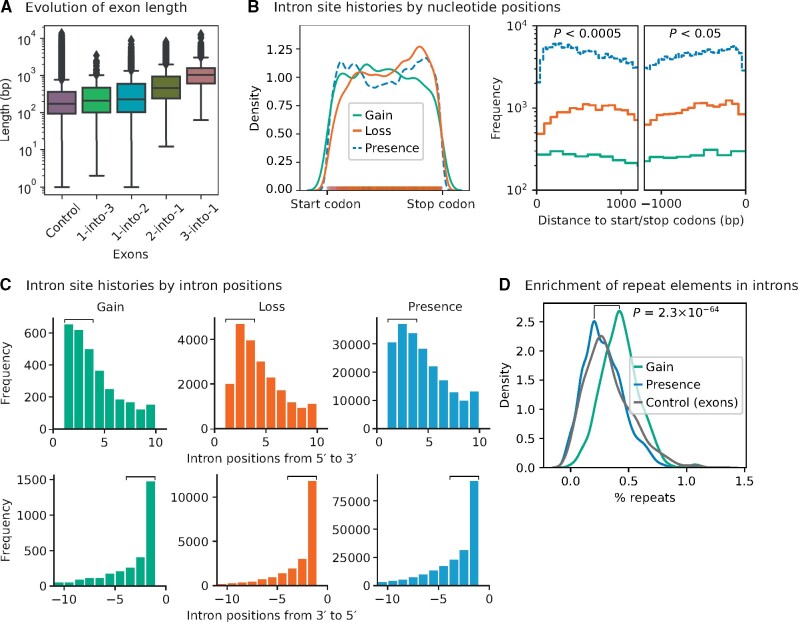
Fig. 4.
Evolution of the exon–intron gene structure. (A) Intron gain and loss (posterior probability ≥0.99) gave rise to significantly larger than average exons. Intron gain resulted in one exon to be split into multiple exons (“1-into-2” or “1-into-3”), whereas intron loss led to a merger of multiple exons (“2-into-1” and “3-into-1”). The median length of “3-into-1” exons is twice larger than “2-into-1,” and six times larger than the extant exons have not been reshaped (“Control”) in 1,444 sets of orthologs (two-sample t-tests, P < 10−170; see also, supplementary tables S3 and S4, Supplementary Material online). (B) Kernel density estimate plot shows the distributions of intron site histories along the gene body (length normalized, left panel). The rug plot superimposes the distributions of intron gain and loss sites. Histograms show the frequencies of intron site histories at the 5′ and 3′ ends of genes (right panel: pairwise Kolmogorov–Smirnov test). (C) The frequencies of intron gain, loss, and presence at the first and last three intron positions of genes are significantly heterogeneous (square brackets). Introns are preferentially gained the few intron positions of genes (upper panel: pairwise χ2 test for the first three intron positions, P < 10−8). In contrast, introns are preferentially lost at the 3′ ends of genes (lower panel: pairwise χ2 test for the last three intron positions, P = 5.0 × 10−44 for “Loss” vs. “Presence”; P = 4.2 × 10⁻⁶ for “Gain” vs. “Presence”; P = 0.25 for “Gain” vs. “Loss”). (D) Recently gained introns are significantly enriched with repeat elements compared with older introns (Kolmogorov–Smirnov test, P = 2.3 × 10−64; see supplementary table S5, Supplementary Material online, for the list of repeat elements detected in recently gained introns). The proportions of repeat elements in introns, exons, and intergenic regions were estimated using bootstrap resampling. The median percent repeats in those introns that are recently gained, presence, and the extant exons have not been reshaped (“Control”) in 1,444 sets of orthologs are 0.42%, 0.28%, and 0.29%, respectively. The median percent repeats in the intergenic regions of 249 or 263 fungi species is 5.4% (supplementary fig. S3, Supplementary Material online).

