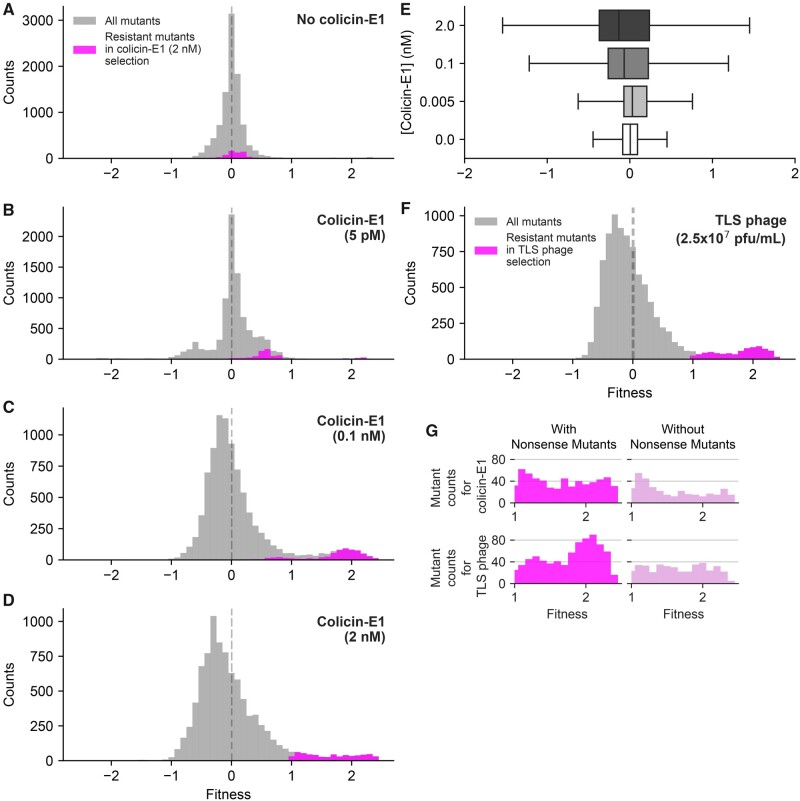
Fig. 3.
Impact of selection strength on DFE. (A–D) Selection strength alters the shape and (E) width of the distribution of fitness effects under colicin-E1 selection. We measured fitness effects of TolC mutations by Illumina NovaSeq sequencing platform which yielded ∼100 times more reads per mutation, compared with Illumina MiSeq platform, and increased resolution of our fitness measurements. DFEs for TolC mutations under selection with (A–D) increasing concentrations of colicin-E1, and (F) TLS phage (2.5×10⁷ pfu/ml). Magenta colored bins in panels (A) to (D) highlight resistance-conferring mutations that had fitness values larger than 1 (10-fold change in frequency) under selection with 2 nM of colicin-E1. Magenta colored bins in panel F highlight resistance-conferring mutations that had fitness values larger than 1 under phage selection. (G) (left) Histograms of all resistance-conferring mutations under colicin-E1 (2 nM, 685 mutations) selection and TLS phage selection (761 mutations). (right) Histograms of all resistance-conferring mutations, excluding stop codon mutations, under colicin-E1 (2 nM, 372 mutations) selection and TLS phage selection (408 mutations).

