Fig. 4.
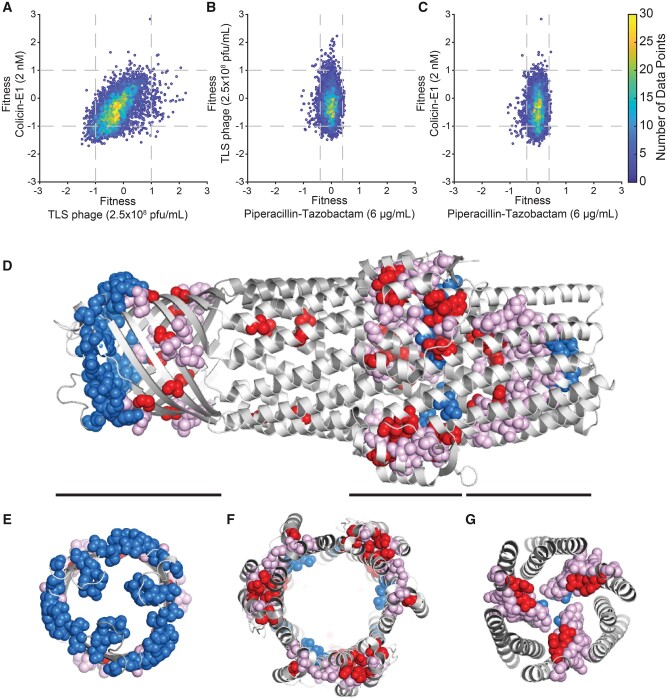
Analysis of mutations from selection experiments. (A–C) Comparison of fitness effects of TolC mutations under different selections. These fitness values correspond to consistent values used to plot histograms in figure 2C–H. Horizontal and vertical dashed lines indicate the significance thresholds (±1.5 SD) for each selection condition, which correspond to ∼10-fold increase or decrease in frequency relative to wild-type TolC (fitness values >+1 and <−1) under colicin-E1 or TLS phage selection. Significance threshold under antibiotic selection were ∼2.5-fold increase or decrease in frequency relative to wild-type TolC (fitness values > +0.4 and < −0.4). (D) Side view of the TolC trimer. The 47 most sensitive residues (representing the top 10%) for TLS and colicin E1 are shown in spheres. Positions that show sensitivity to TLS only are colored blue, sensitivity to colicin E1 only in red, and sensitivity to both perturbations in pink. Black bars correspond to slices along the pore axis, shown in (E–G) highlighting the three structural regions where sensitive residues are located.

