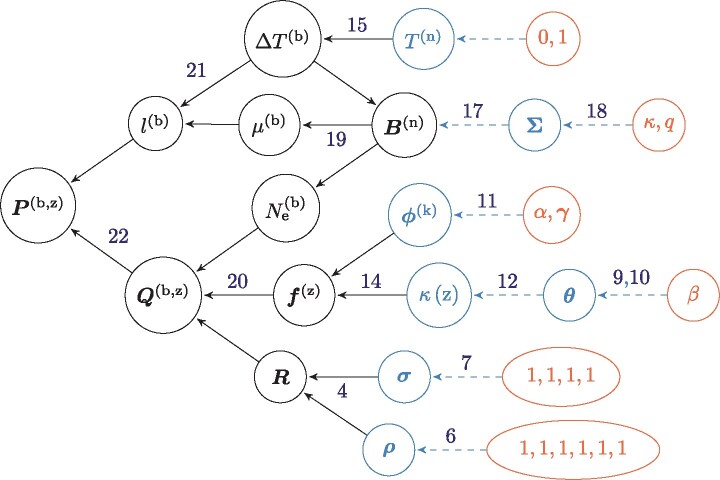
Fig. 5.
Directed acyclic graph (DAG) of dependencies between variables. Nodes of the directed acyclic graph are the variables, and edges are the functions. Hyper-parameters are depicted in red circles, random variables in blue circles, and transformed variables in black. Blue dashed line denotes a drawing from a random distribution, and black solid lines denote a function. All the nodes pointing toward a given node (upstream) are its dependencies which determine its distribution. The other way around, following the arrows in the DAG (downstream), simple prior distributions are combined together to form more complex joint prior distribution which ultimately defines the prior distribution of the model.

