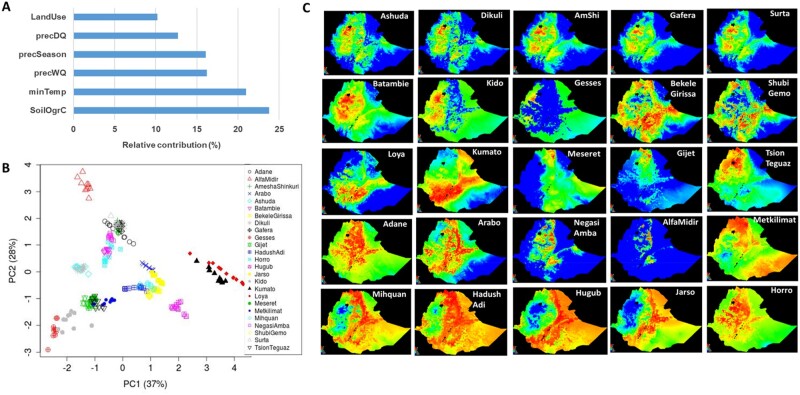
Fig. 2.
(A) Relative contribution of the six environmental variables selected based on Ecological Niche Modeling (ENM); (B) PCA plots showing the distribution of the 25 Ethiopian chicken populations in the environmental space provided by the six selected environmental parameters; (C) suitability maps of the 25 Ethiopian chicken populations produced by ENM using six selected environmental variables. Hotter colors (toward red spectrum) indicate more suitable conditions.

