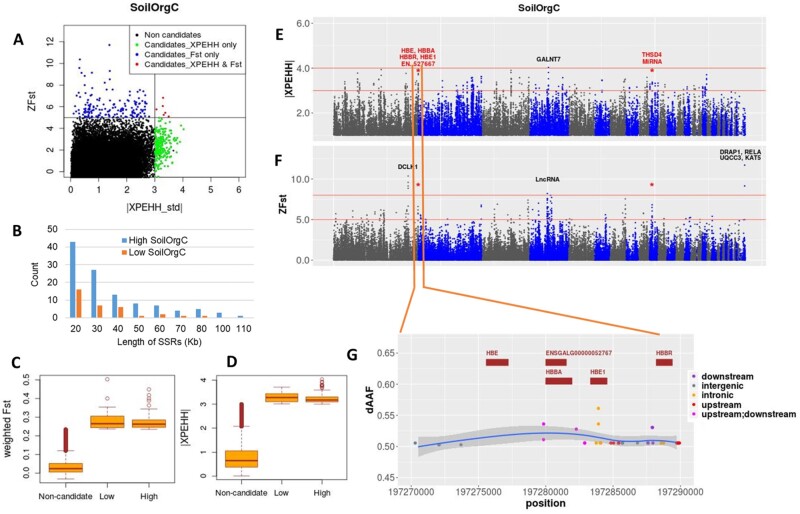
Fig. 7.
Selection signature analysis results for SoilOrgC. (A) Scatter plot of standardized values of XPEHH versus Fst. (B) Length distribution of selective Sweep Regions (SRs). (C, D) Box plots showing the distribution of Fst and XPEHH metrics for noncandidate and candidate windows. (E, F) Manhattan plots for the XPEHH and Fst analyses; common windows are marked with asterisk and gene names from common windows are shown in red. (G) Closer look of the common Fst/XPEHH region chr1:197270000 − 197290000 with SNPs showing allele frequency difference (dAAF) > 0.5 between the Low (Loya, Kumato) and High (Meseret, Gijet) groups. Genes common between Fst and XPEHH are shown in red.

