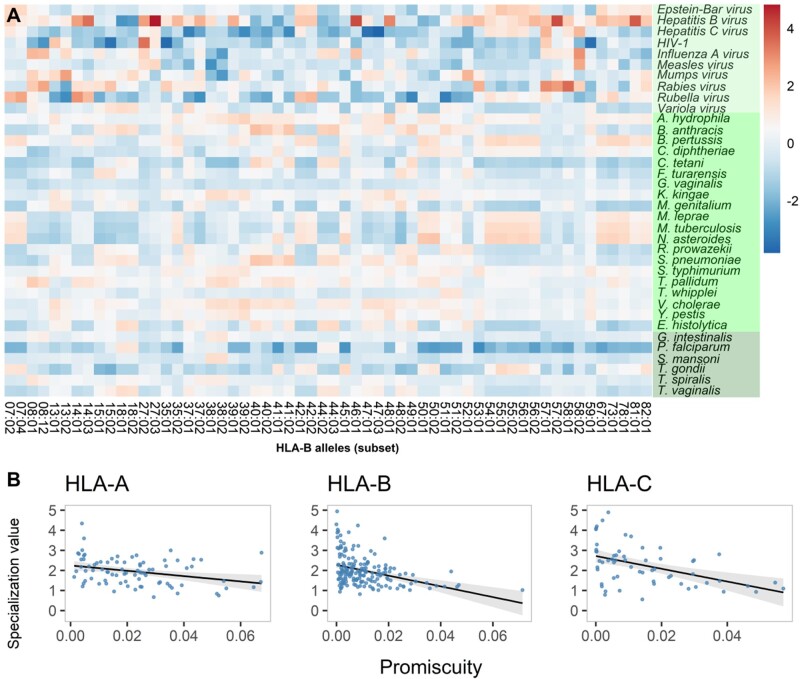
Fig. 3.
(A) Standardized proportions of bound peptides from distinct pathogens varies greatly among HLA-B variants. Each cell represents the proportion of bound peptides by the HLA variant (on horizontal axis) from the corresponding pathogen (on vertical axis). Proportions are standardized within each variant to make comparisons across variants possible. Dark red color indicates high specialization, white no specialization, and dark blue indicates lower than average binding of a pathogen’s peptides. Green shading on vertical axis labels indicates different pathogen groups (light green; viruses, green; bacteria, dark green; eukaryotes). In this plot, only a subset of HLA-B variants were included for better visualization. The subset was selected such that a maximum of two variants with the same first field number and smallest second field number were included (e.g., only B*15:01 and B*15:02 of all the variants of the B*15 lineage). The patterns are similar across all variants of all three HLA loci. For the complete set of HLA-A, HLA-B, and HLA-C variants, see supplementary figure S7, Supplementary Material online. (B) Specialization is negatively correlated with promiscuity for all HLA class I loci. Each dot represents an HLA variant of the given HLA gene, shown separately for HLA-A (n = 82), HLA-B (n = 180), and HLA-C (n = 59). Specialization was calculated for each variant as the difference between the maximum and the median values of standardized proportions of bound peptides. Promiscuity was calculated for each HLA variant as the fraction of the bound peptides among the complete data set of 51.9 Mio peptides. Linear regression line is shown in black and 95% CI around the line in gray.

