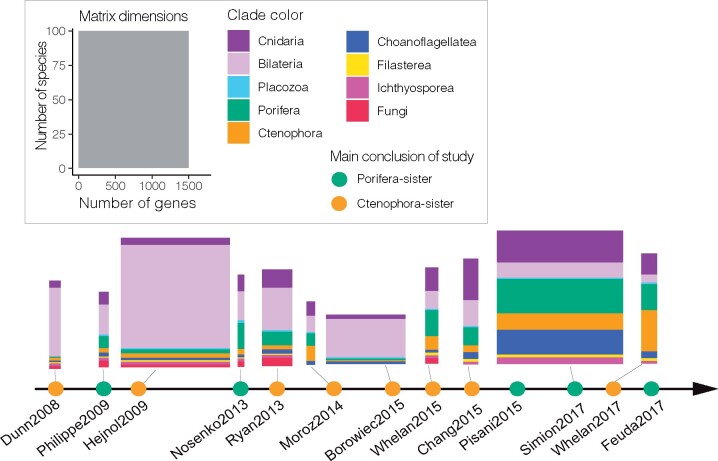
Fig. 2.
An overview of previous phylogenomic studies on animals. The horizontal axis is a time-series showing the main conclusions of previous phylogenomic studies that indicated their analyses supported Ctenophora-sister (orange nodes) or Porifera-sister (green nodes) based on their main conclusion from each study. Each of the primary matrices considered here is shown above the axis, color coded by taxon sampling. Horizontal size is proportional to the number of genes sampled, vertical size to the number of species sampled. Only 11 matrices were shown here since three studies (Pisani et al. 2015; Whelan and Halanych 2016; Feuda et al. 2017) are based entirely on previously published data and gene-partition data is not available from one study (Pick et al. 2010).

