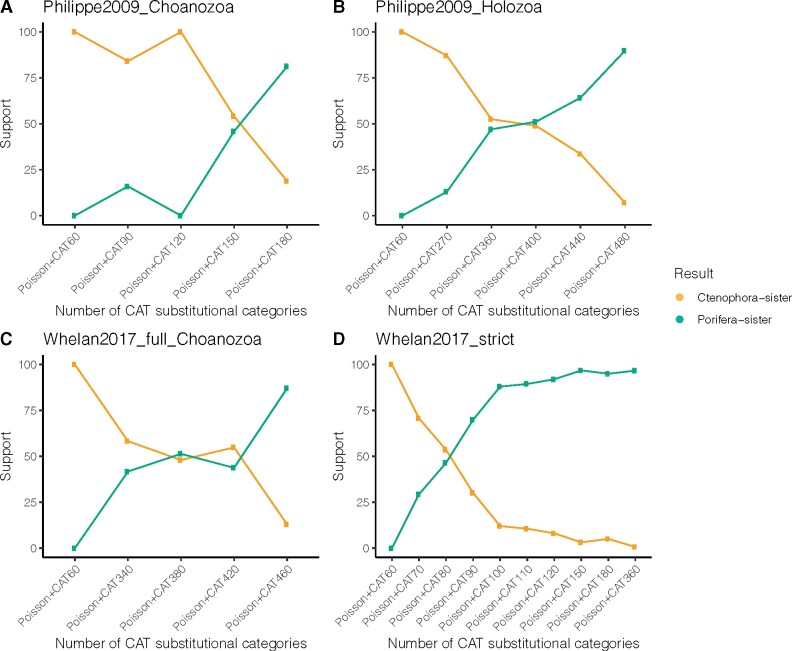
Fig. 4.
Sensitivity analyses with representative data matrices were analyzed by different number of equilibrium frequency categories (nCAT) in PhyloBayes. Statistical support values (posterior probabilities) were obtained from three data matrices using the site-heterogeneous Poisson+CAT model with different categories. (A) Phlippe2009_Choanozoa; (B) Philippe2009_Holozoa; (C) Whelan2017_full_Choanozoa; (D) Whelan2017_strict. Statistical support for Ctenophora-sister and Porifera-sister is indicated in orange and green, respectively. Support values from the sensitivity analyses are shown in supplementary table S6, Supplementary Material online.

