Fig. 4.
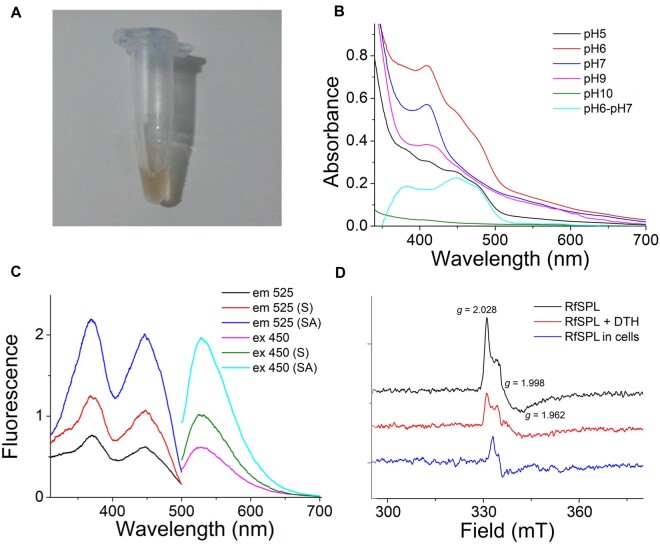
RfSPL is an iron–sulfur cluster containing flavoprotein. (A) The concentrated RfSPL sample purified at pH 6.0 exhibited a brownish yellow color. (B) The UV-vis absorption spectra of the RfSPL samples purified at various pH values: pH 5.0, black line; pH 6.0, red line; pH 7.0, blue line; pH 9.0, magenta line; pH 10.0, olive line. The differential spectrum of the sample purified at pH 6.0 and that purified at 7.0 was represented in a cyan line. The result of the RfSPL sample purified at pH 8.0 was not shown which was similar to that of the sample purified at pH 7.0. (C) The fluorescence spectra of the RfSPL sample purified at pH 6.0, the sample supernatant after boiling and centrifuging (indicated by (S)), and the sample supernatant when the pH value of which was lower to 2.0 (indicated by (SA)). For the excitation spectra (black, red, and blue lines), the emission wavelength was set to 525 nm. For the emission spectra (magenta, olive, and cyan lines), the excitation wavelength was set to 450 nm. (D) The EPR spectra of RfSPL. The black and red lines were the signals of the RfSPL sample purified at pH 6.0 before and after treatment with 3 mM sodium dithionite (SDT) for 10 min. The blue line was the signal of overexpressed RfSPL protein in Escherichia coli cells.

