Fig. 1.
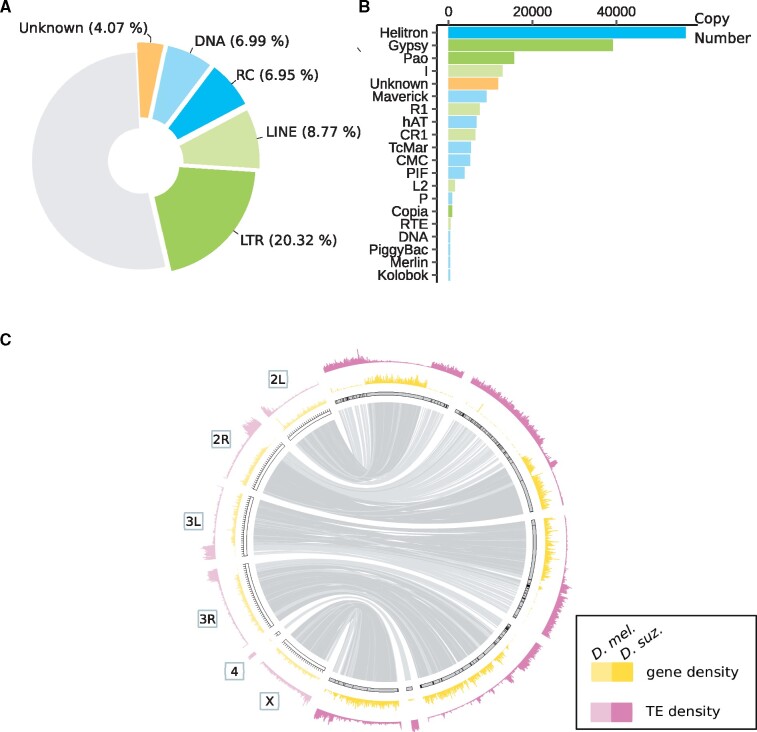
Main features of the TE content in the Drosphilla suzukii reference genome. (A) TE genomic occupancy. Piechart illustrating genomic sequence occupancy of each TE order (in percentages of the assembly). (B) TE copy numbers. Bar plot representing TE copy numbers for the 20 TE superfamilies displaying the highest copy numbers. (C) Distribution of TEs and genes. TE density and gene density are shown for windows of 200 kb. Lighter shades correspond to D. melanogaster and darker shades correspond to D. suzukii. The maximum value of gene density is 54 for D. suzukii and 102 for D. melanogaster. The maximum number of TE fragments is 713 for D. suzukii and 442 for D. melanogaster. Syntenic relationships between D. melanogaster and D. suzukii assemblies are shown inside using light links for regions of low gene density (<7 genes per 200 kb in D. suzukii assembly) and dark links for regions of high gene density (≥7 genes/200 kb). Contigs are surrounded by black strokes. Ticks on D. melanogaster assembly are separated by 1 Mb.

