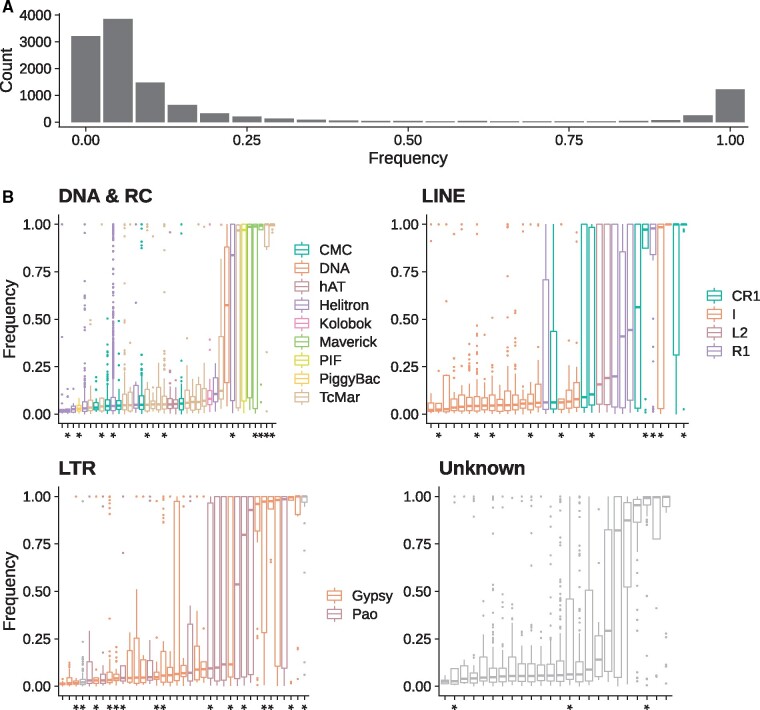
Fig. 2.
TE activity in the Drosophila suzukii reference population from Watsonville (USA). (A) Frequency distributions of TE insertions. (B) Population frequencies for each TE family. Pseudofamilies are indicated by a star on the x-axis. Only families/pseudofamilies with more than ten insertions in the reference population are shown. DNA and RCs have been grouped for graphical reasons.

