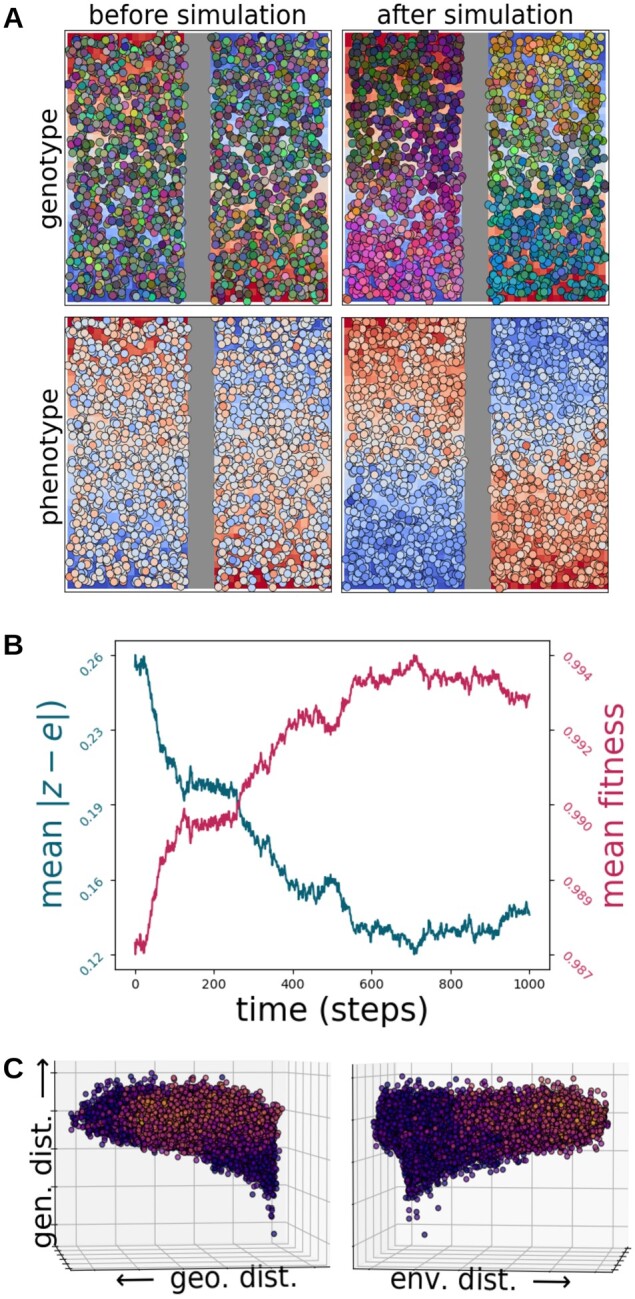
Fig. 3.

Results of simulations for the isolation by distance (IBD) and isolation by environment (IBE) example application, in which a species evolved on a landscape with a barrier layer that served as the movement surface (displayed as a vertical gray band down the landscape) and an environmental layer that served as the selective surface for a 10-locus trait (displayed as the red to blue gradient on the landscape). (A) The population before the simulation (left column) and after it (right column), colored by genetic distance (top row), with colors derived from scores on the first three PCs of a genetic PCA used to assign RGB values, and by phenotype (bottom row). The most-fit individuals are those whose phenotypic colors perfectly match the cells on which they are located. (B) The time courses of the mean difference between individuals’ phenotypes and their environmental values (blue) and of mean fitness values (red). (C) Two views of a 3D scatter plot of pairwise genetic distance as a function of Euclidean geographic distance (left) and Euclidean environmental distance (right), with points colored by phenotypic distance.
