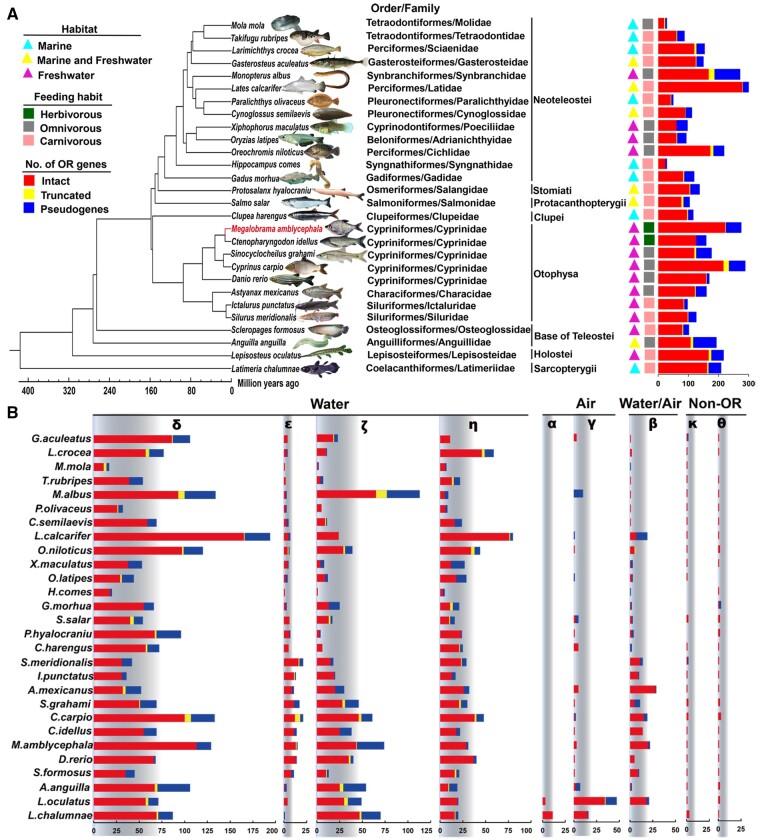
Fig. 2.
Phylogenetic tree and number of OR genes in 28 fish species. (A) Phylogenetic tree depicting the evolutionary relationships of 28 fish species. Genome of M. amblycephala sequenced in this study is highlighted in red. Habitat and feeding habits are depicted for each species. Bars represent the total OR numbers. (B) The number of OR genes from each subfamily across 28 fish species. Red, yellow and blue bars represent intact genes, truncated genes and pseudogenes, respectively. “Water,” “Air,” and “Water/Air” represent the detection of water-soluble, airborne and both water and airborne odorants, respectively.

