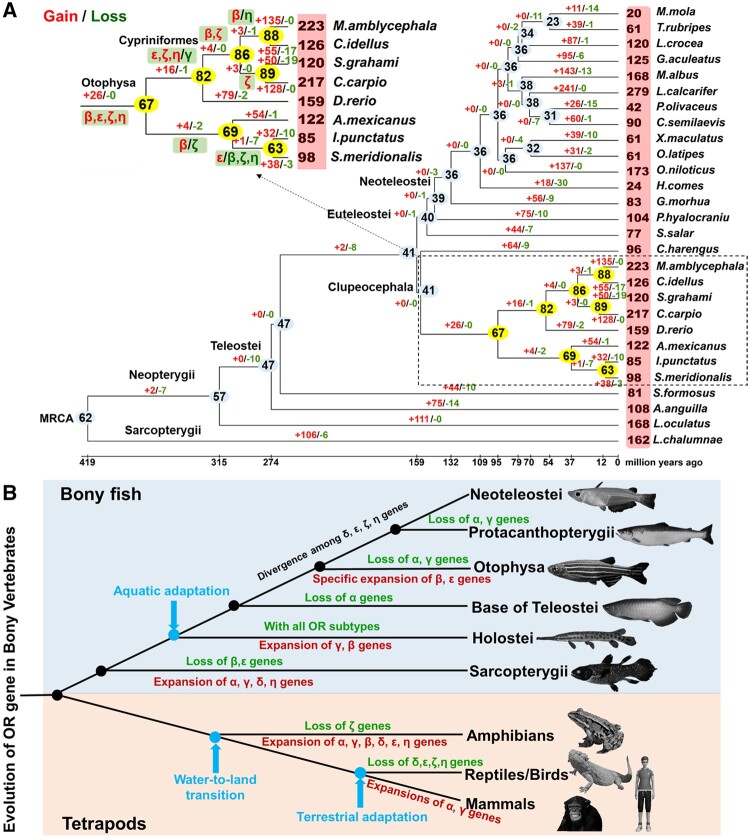
Fig. 3.
Evolutionary dynamics of OR genes in fish and tetrapod. (A) Changes in the number of OR genes during the evolution of 28 fish species inferred from intact genes. Numbers in the red rectangular box indicates the number of intact OR genes in each fish species. The estimated number in light blue and yellow oval represents the number of OR genes at an ancestral node. Estimated numbers of gene gains and gene losses in each branch are also shown with red plus and green minus signs. (B) Schematic illustration of the evolution of OR gene families in bony vertebrates.

