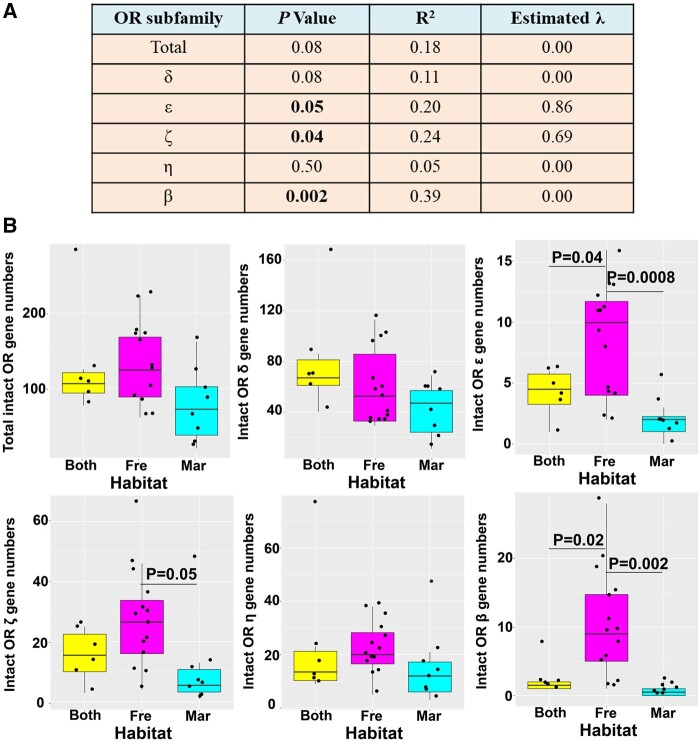
Fig. 4.
OR genes subfamilies were compared among fish with different habitats. (A) Phylogenetic generalized least squares (PGLS) regression analysis for number of intact OR genes in fish species (n = 28) versus ecological niches (habitats). (B) Box plot of intact OR gene numbers among groups of divergent ecological niches. One-way ANOVA analysis and Tukey HSD test were conducted to determine statistical difference among groups. Mar, marine; Fre, freshwater; Both, both in marine and freshwater.

