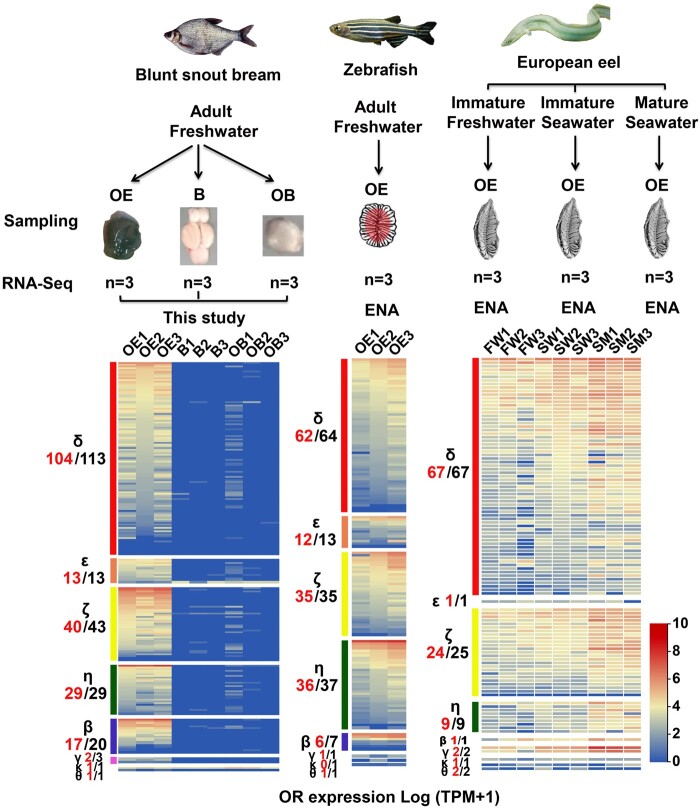
Fig. 6.
Gene expression profiles of ORs in M. amblycephala, D. rerio and A. anguilla. A total of nine sequencing libraries, including three olfactory epithelium (OE), three whole brain (B) and three olfactory bulb (OB) of M. amblycephala were sequenced. Three RNA-seq raw data of OE from adult D. rerio and nine OE from A. anguilla were also analyzed. RNA expression levels are represented on a log2(X + 1) scale of normalized TPM (0, not expressed; 10, highly expressed). OR genes in each subfamily are displayed in descending order of their expression values. Numbers labeled in red represent the number of expressed OR genes while numbers in black are the total number of intact genes in each subfamily.

