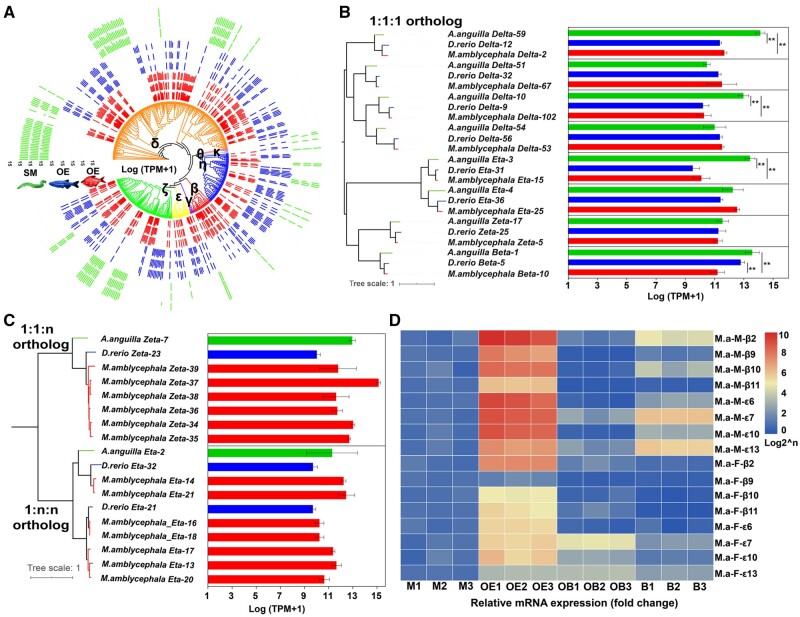
Fig. 7.
Comparison of OR genes expression patterns among different fish species. (A) Unrooted phylogenetic tree and normalized expression levels for all intact OR genes among M. amblycephala, D. rerio and A. anguilla. Bars indicate the relative expression level represented on a log2(X + 1) scale of normalized TPM. (B) and (C) Phylogenetic tree (left) and expression levels (right) of 1:1:1 and 1: n: n OR orthologs in A. anguilla, D. rerio and M. amblycephala. Bars showed the RNA-seq expression values (mean ± SD, n = 3) for the OR genes in fish OE. One-way ANOVA analysis and Tukey HSD test were conducted to determine statistical difference among species (**P < 0.01). (D) The relative expression levels of representative β and ε OR genes detected by qRT-PCR. Expression in olfactory epithelium (OE), olfactory bulb (OB) and brain tissues (B) were normalized to the expression in muscle (M). M.a-M, male M. amblycephala; M.a-F, female M. amblycephala.

