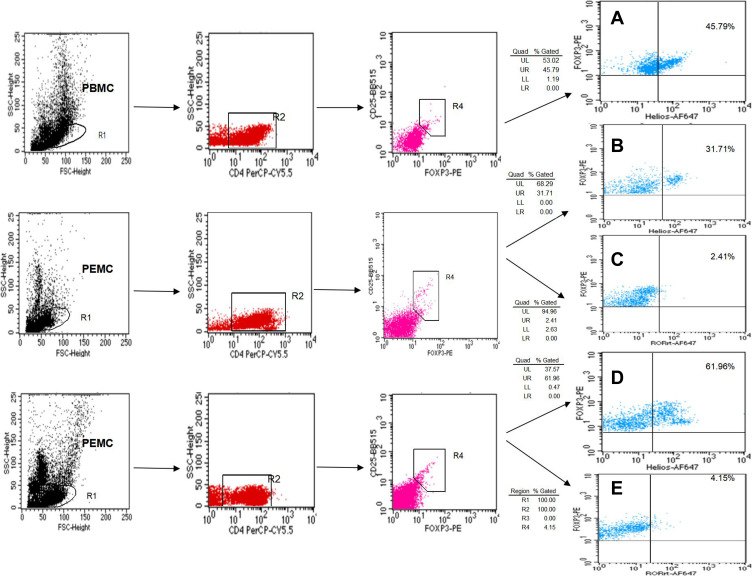
Figure 1.
The percentage of Tregs and Th17 cells from PBMCs and PEMCs. (A) Dot plots of CD4+CD25+Foxp3+Helios+ Tregs in PBMCs from patients with NSCLC. (B and C) representative dot plots of CD4+CD25+Foxp3+Helios+ Tregs and CD4+CD25+Foxp3+ RORγt+ Tregs in PEMCs from the same patient with NPE, respectively. (D and E) representative dot plots of CD4+CD25+Foxp3+Helios+ Tregs and CD4+CD25+Foxp3+RORγt+ Tregs in the PEMCs from the same patient with NSCLC, respectively.

