
Fig. 1 |. Cytokine levels and phosphorylation of STATs in NK cells in spleen and blood peak early during MCMV infection.
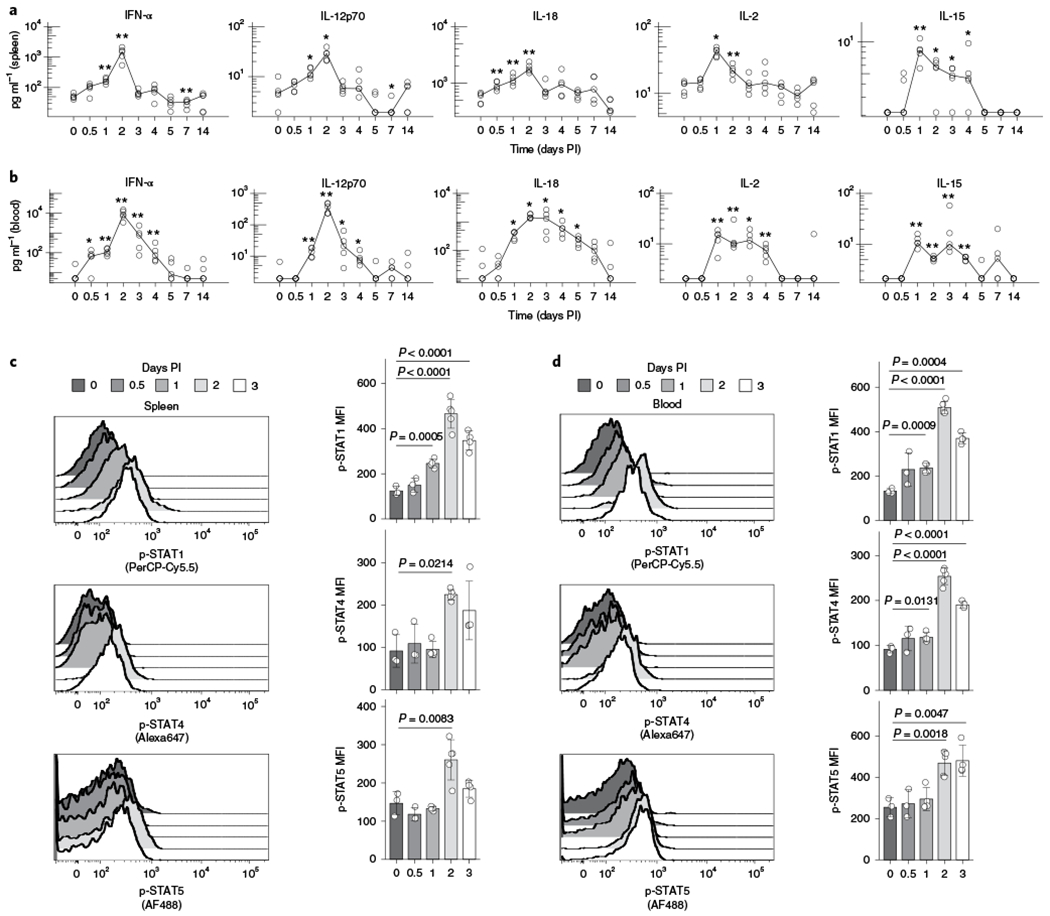
Spleens and blood were collected at days 0, 0.5, 1, 2, 3, 4, 5, 7 and 14 after MCMV infection. Spleens were lysed for protein extracts and serum was collected from blood samples for cytokine measurement. NK cells from spleens and blood were stained for p-STAT1 (Ser), p-STAT4 (Tyr) and p-STAT5 (Tyr). a, Graphs show cytokine levels (pg ml−1) of IFN-α, IL-12p70, IL-18, IL-2 and IL-15 in the spleen over time, with log10 scale on the y axis. Lines connect at medians of each time point. *P = 0.011–0.045, **P = 0.0073–0.0079 from two-sided Mann–Whitney–Wilcoxon test as compared to day 0. b, Same as a, in blood serum. c, Histograms (left) and bar plots (right) depict mean ±s.d. of phosphorylated STAT levels on NK cells (CD3ε−TCRβ−NK1.1+) in the spleen at indicated time points after infection. P values are calculated from two-sided Welch’s t-test as compared to day 0. d, Same as c, in blood serum. MFI, mean fluorescence intensity. n = 5 (a,b) and n = 3–5 (c,d).