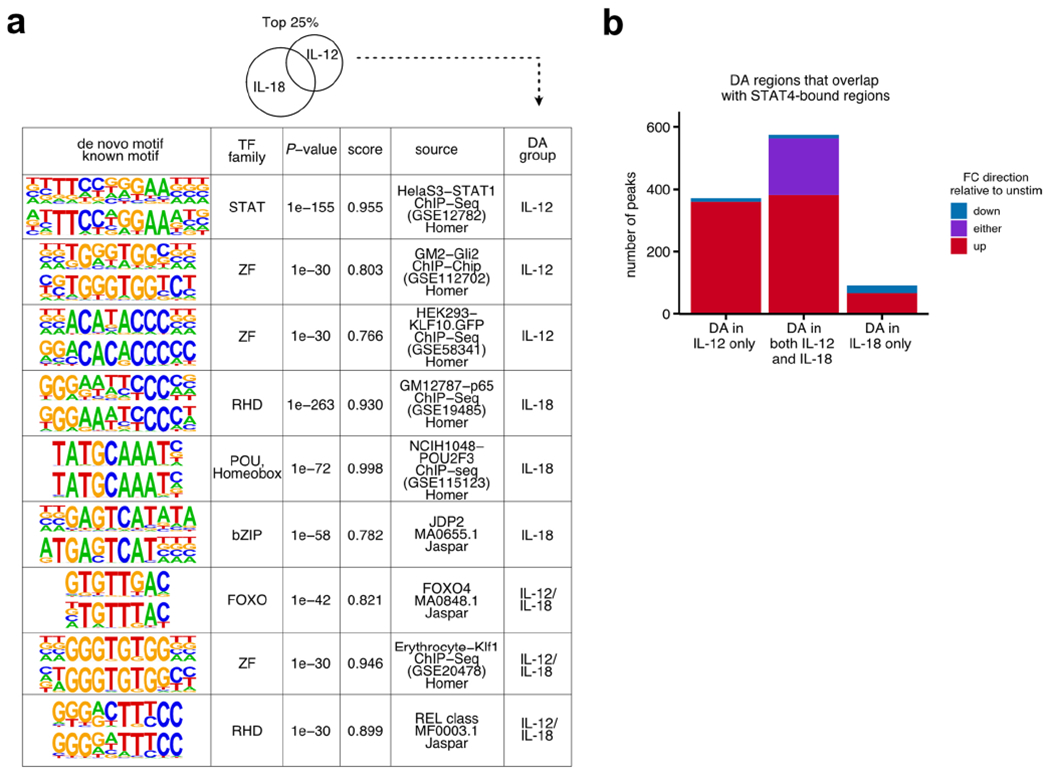
Extended Data Fig. 4 |. Epigenetic contribution of IL-12 versus IL-18.

ATAC-seq was performed on sorted NK cells (CD3ε− TCRβ− CD19− F4/80− NK1.1+) cultured for 3 h with IL-12, IL-18, or IL-12 + L-18. n = 3. a, Tables show results for de novo motif analysis by HOMER software on top 25% DA regions (see Methods). From left to right, columns show discovered motif sequence (top) with the best matched known motif (bottom), best matched known transcription factor family, p-value, similarity score, source of data used to derive known motif, and DA group. For all groups, top 3 ranked on p-value are shown. b, Bar plot depicts number of DA regions (FDR-adjusted p-value < 0.05) that overlap with STAT4-bound ChIP-seq regions, broken down by DA group. Colors indicate FC direction of DA regions.FDR = false discovery rate; DA = differentially accessible.
