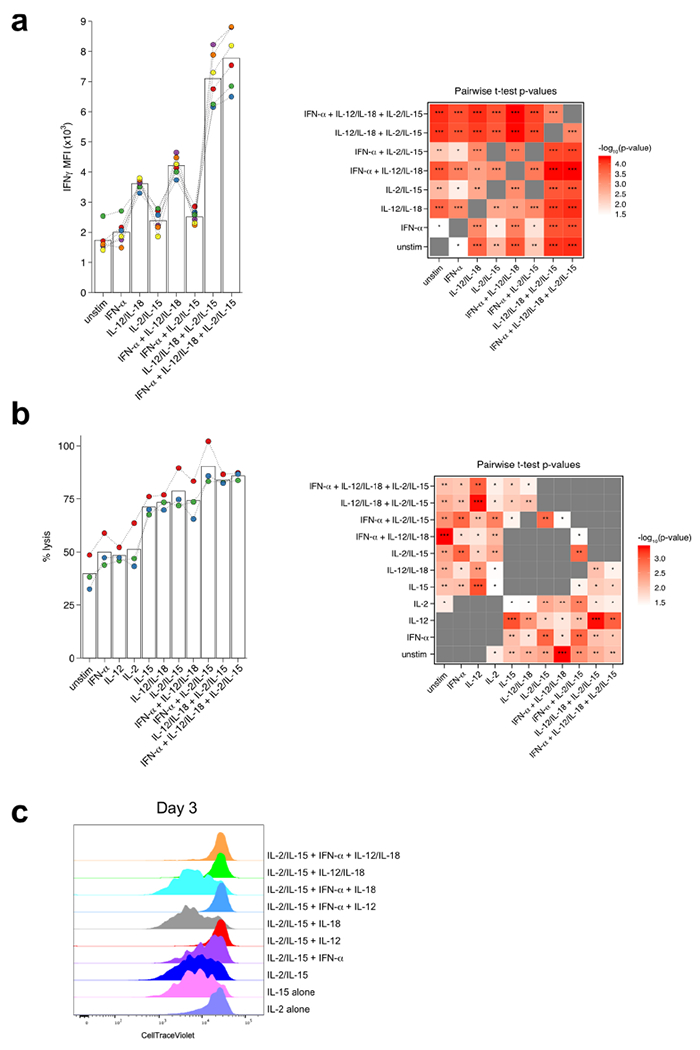
Extended Data Fig. 6 |. Combination of various cytokine conditions supports optimal NK cell effector responses in vitro.

a, Bar plots show intracellular IFN-γ after 3 h of indicated cytokine stimulation on sorted NK cells (CD3ε− TCRβ− CD19− F4/80− NK1.1+). Calculated p-values for all pairwise conditions are represented as a heatmap. n = 6. b, Bar plots show calculated percent lysis of Calcein AM-labeled YAC-1 cells incubated with sorted NK cells (CD3ε− TCRβ− CD19− F4/80− NK1.1+) in the indicated cytokine conditions. Calculated p-values for all pairwise conditions are represented as a heatmap. n = 3. c, Representative histograms of Cell Trace Violet staining on sorted NK cells from 3-day in vitro cultures under indicated conditions. Representative of 3 independent experiments. Dotted lines connect biological replicates, which are colored. * p < 0.05, ** p < 0.01, *** p < 0.001 by two-tailed paired Student’s t-test.
