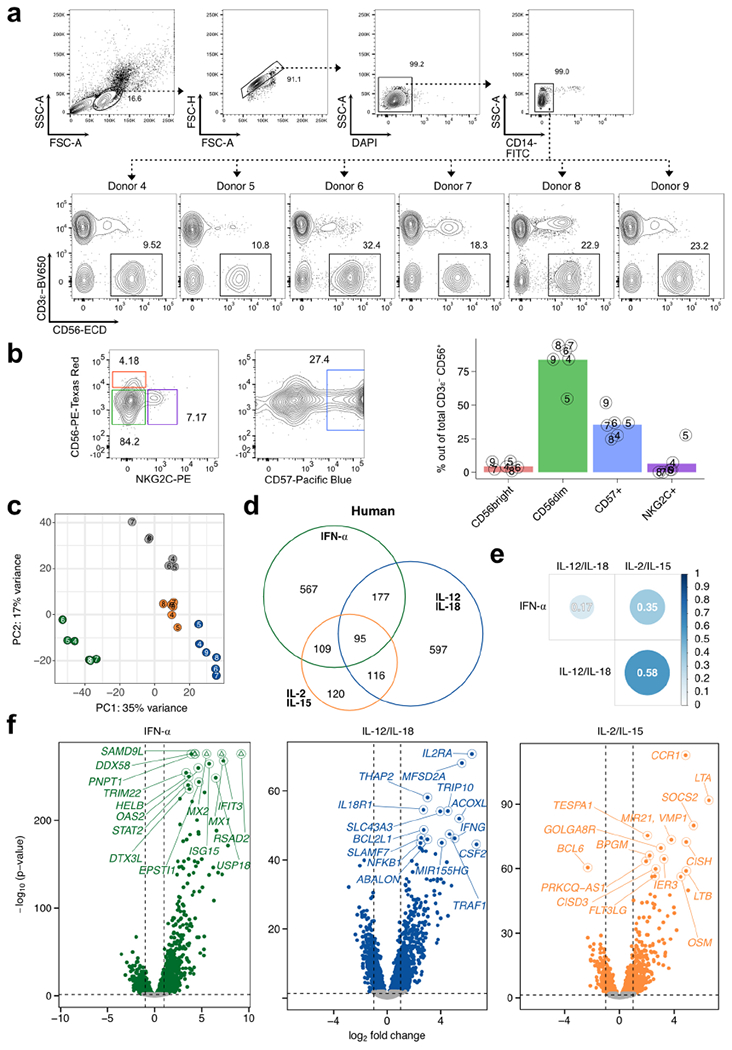
Extended Data Fig. 7 |. Transcriptional profiles of cytokine signaling in human NK cells.

RNA-seq was performed on sorted NK cells (CD3ε− CD14− CD56+) derived from PBMCs of healthy donors and cultured for 3 h with IFN-α, IL-12/IL-18, or IL-2/IL-15. n = 6. a, Sorting strategy of human NK cells and NK cell percentages for each donor. b, Representative flow cytometric plot (left) and summarized proportions (right) of different NK cell subsets defined by cell surface phenotype. Bar plots show mean, and numbers indicate donor identifier. c, Principal component analysis of RNA-seq donor-corrected, log-transformed counts of all detectable genes in humans. d, Venn diagram of all commonly expressed, mappable DE (FDR-adjusted p-value < 0.05, |log2 FC|>1) human orthologs when comparing cytokine-stimulated versus unstimulated conditions. e, Heatmap matrix of Spearman correlation coefficients using log2 FC of each condition compared to unstimulated from all commonly expressed, mappable human DE genes. Circle sizes are proportional to coefficients. f, Volcano plots highlight top 15 DE genes (FDR-adjusted p-value < 0.05) ranked on p-value. x-axis depicts log2 FC and y-axis depicts −log10 (p-value) (Wald test). Shown are all expressed genes (TPM>5) comparing indicated cytokine stimulation versus unstimulated. Horizontal dashed line delineates p = 0.05, vertical dashed lines mark log2 FC of −1 and 1. Colored dots show DE genes. Triangles indicate capped p-values. DE = differentially expressed; FDR = false discovery rate; FC = fold change; TPM = transcripts-per-million.
