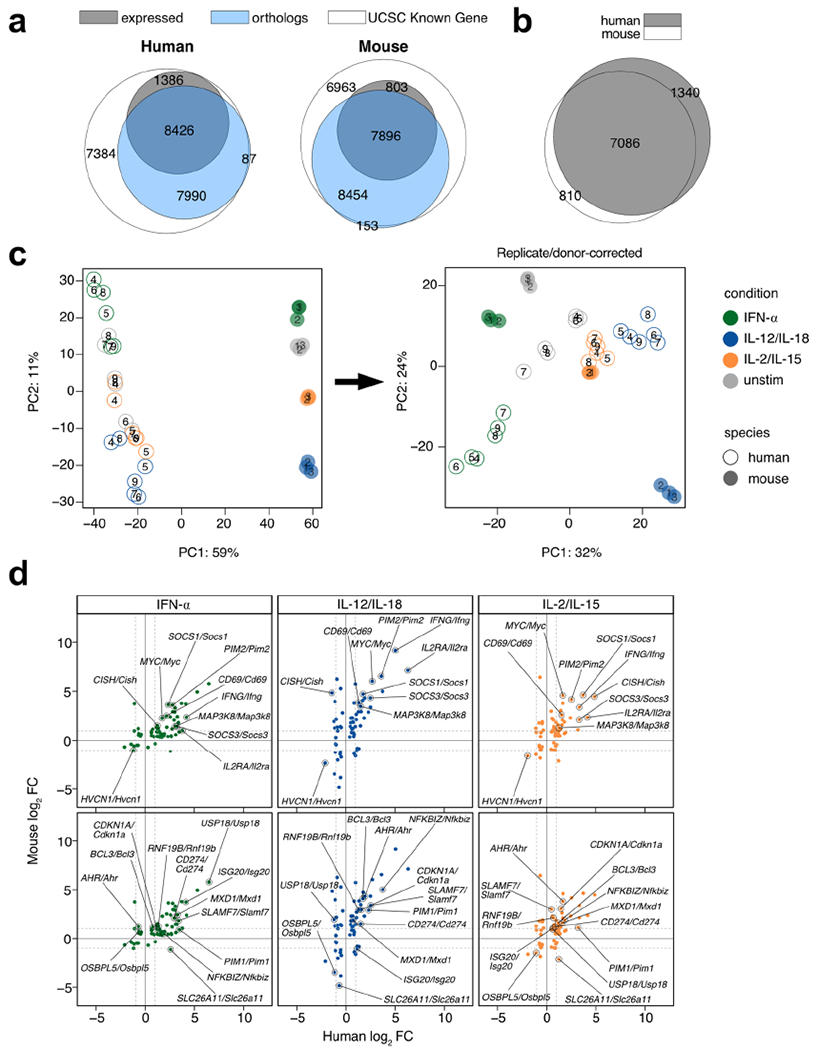
Extended Data Fig. 8 |. Highly modulated genes induced by cytokines are conserved between mouse and human.

For human data, RNA-seq was performed on sorted NK cells (CD3ε− CD14− CD56+) derived from PBMCs of healthy donors and cultured for 3 h with IFN-α, IL-12/IL-18, or IL-2/IL-15. Mouse data was performed as described in Fig. 2. For mouse, n = 3, and for human, n = 6. a, Venn diagram of all genes in the UCSC Known Gene reference annotation (white), all mappable orthologs annotated by NCBI and retrieved through HGNC (blue), and counted genes that showed an average TPM >5 across all conditions. Numbers show absolute numbers. b, Venn diagram of mappable and expressed orthologs from mouse and human. Numbers show absolute numbers. Intersection depicts commonly expressed mappable orthologs used for downstream DE analysis. c, Principal component analysis of RNA-seq uncorrected log-transformed counts on (left) and those corrected for replicate/donor variation (right) on commonly expressed mappable orthologs. d, Scatter plots of RNA-seq log2 FC comparing cytokine-stimulated versus unstimulated from human datasets (x-axis) and mouse datasets (y-axis). Shown are genes commonly DE in all three cytokine conditions across human and mouse. Plots highlight genes that show |log2 FC|> 1 in all three conditions (top) or two of the three conditions (bottom). DE = differentially expressed; FC = fold change; TPM = transcripts-per-million.
