
Fig. 2 |. Transcriptional cooperation and antagonism among proinflammatory and homeostatic cytokines.
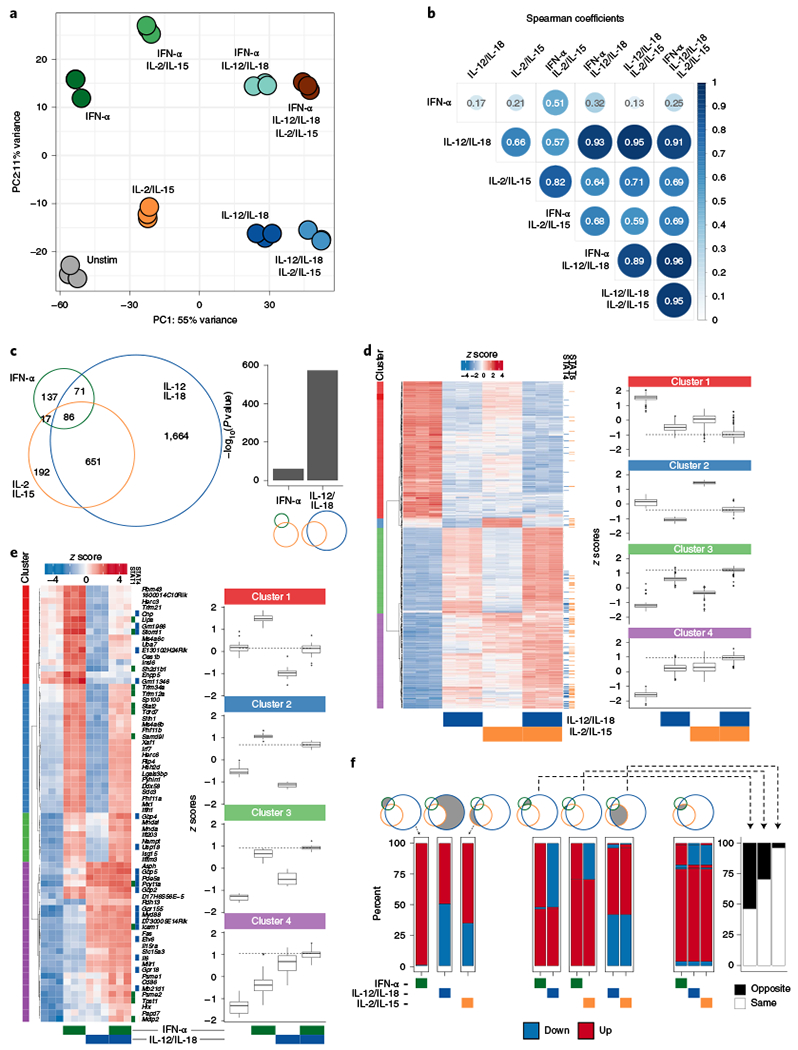
RNA-seq was performed on sorted NK cells (CD3ε−TCRβ−CD19−F4/80−NK1.1+) cultured for 3 h with IFN-α, IL-12/IL-18, IL-2/IL-15 or any combination of the three conditions (n = 3). a, PCA of RNA-seq log-transformed counts on all detectable genes. b, Heat map matrix of Spearman correlation coefficients using log2 FC of each condition as compared to unstimulated from all expressed genes (TPM > 5). Circle sizes are proportional to coefficients. c, Venn diagram depicts numbers of top expressed DE genes (FDR-adjusted P value <0.05, |log2 FC | > 1, TPM > 5) from IFN-α-, IL-12/IL-18- or IL-2/IL-15-stimulated versus unstimulated conditions. Bar graph shows −log10 (P value) of the one-tailed hypergeometric test testing over-representation of IL-2/IL-15 DE genes among IFN-α or IL-12/IL-18 DE genes. d, Heat map of row-scaled log-transformed expression values of the 651 common DE genes only between IL-12/IL-18 and IL-2/IL-15 (left). Tiles to the right of the heat map indicate whether STAT4 (blue) or STAT5 (orange) was bound to the gene by ChIP-seq. Box plots of z scores from each cluster are depicted in the right panel. Dotted lines show median z score of IL-12/IL-18 plus IL-2/IL-15 condition. Center represents median; box represents the limits, first and third percentiles; whiskers show 1.5 × interquartile range. e, As in d, showing the 71 common DE genes only between IFN-α and IL-12/IL-18. f, Stacked bar plots show percent of genes that are either upregulated (red) or downregulated (blue) as compared to unstimulated conditions among DE genes described in c. Bar plot shows percent of genes that change in the opposite (black) or same (white) FC direction (right). FDR, false discovery rate; FC, fold change; TPM, transcripts per million; Unstim, unstimulated.