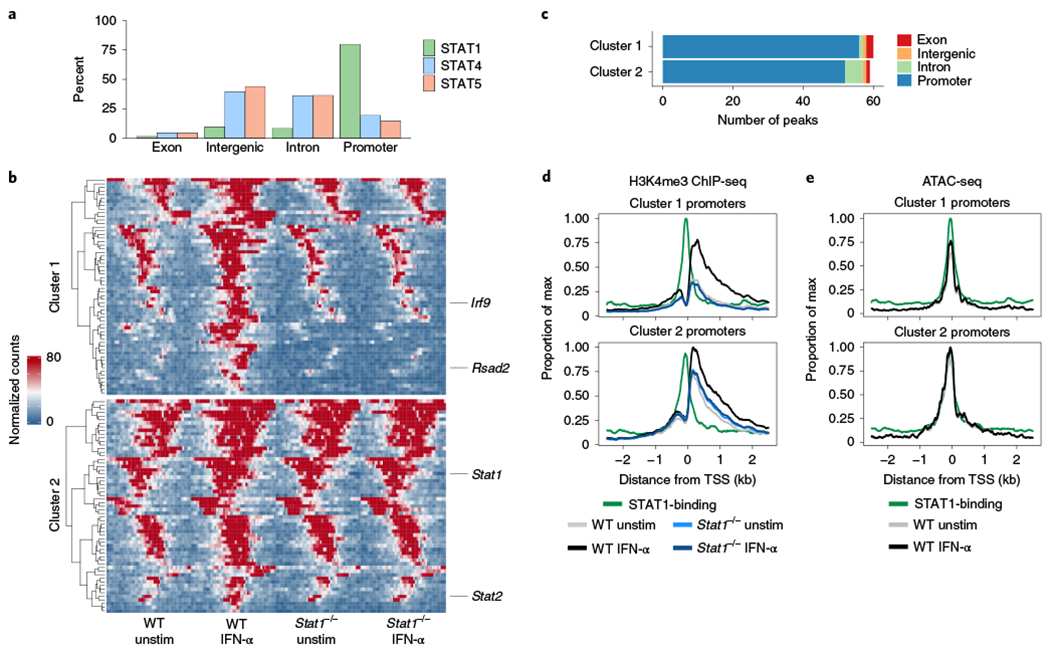
Fig. 4 |. IFN-α promotes changes in H3K4me3 enrichment at promoter regions.

H3K4me3 ChIP-seq was performed on sorted NK cells (CD3ε−TCRβ−CD19−F4/80−NK1.1+) cultured for 3 h with or without IFN-α from WT or Stat1−/− spleens (n = 2–5 replicates per ChIP condition). a, Bar graph shows percentage of peaks bound by indicated STAT by ChIP-seq categorized by region type. b, Heat map shows peak-centered normalized counts of DA regions (FDR-adjusted P value <0.05). Clusters 1 and 2 show regions that are significantly different comparing IFN-α-stimulated to unstimulated, with cluster 1 showing significant differences when comparing WT stimulated to Stat1−/− stimulated. Peaks are plotted in 100-bp bins across a 5-kb window. c, Bar plot shows number of peaks within each cluster categorized by region type. d, Line plots depict meta coverage of all promoter regions in either cluster 1 or cluster 2. e, Line plots depict meta coverage for ATAC-seq signal for same regions described in d. TSS, transcriptional start site; WT, wild type.
