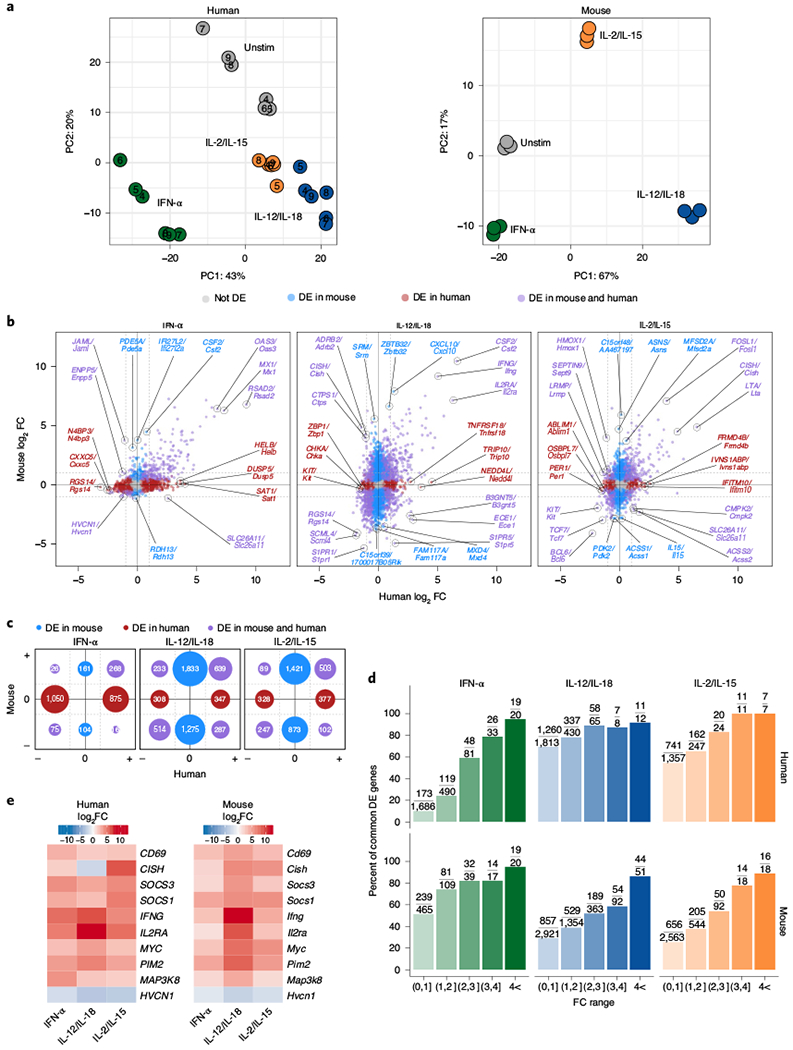
Fig. 7 |. Highly modulated genes induced by cytokines are conserved between mice and humans.

For human data, RNA-seq was performed on sorted NK cells (CD3ε−CD14−CD56+) purified from peripheral blood mononuclear cells (PBMCs) of healthy donors and cultured for 3 h with IFN-α, IL-12/1L-18 or IL-2/IL-15. Mouse data were collected as described in Fig. 2. All genes shown are analyzed from commonly expressed mapped orthologs (Methods). All DE genes are compared to unstimulated conditions. For mouse, n = 3 and for human, n = 6. a, PCA of RNA-seq log-transformed counts in humans (left, corrected for donor) and mice (right). b, Scatter-plots of RNA-seq log2 FC comparing DE orthologs from human datasets (x axis) and mouse datasets (y axis). Red indicates orthologs that were DE (FDR-adjusted P value <0.05) only in human, blue highlights orthologs that were only DE in mouse and purple shows those that were DE in both. Top three genes ranked on average FC from each group and direction of FC are marked, c, Graphical schematic of total number of DE genes depicted in b. Location and colors of circles mirror fold change directions of DE genes and DE category, respectively. Circle sizes are proportional to number of genes. d, Bar plot shows percentage of orthologs that are common DE genes out of total human (top) or mouse (bottom) DE genes found within the FC range. Absolute numbers are shown as fractions above each bar plot. e, Heat map of top DE genes that are both common to mouse and human and common to all three cytokine stimulations that all show a |log2 FC|> 1.
