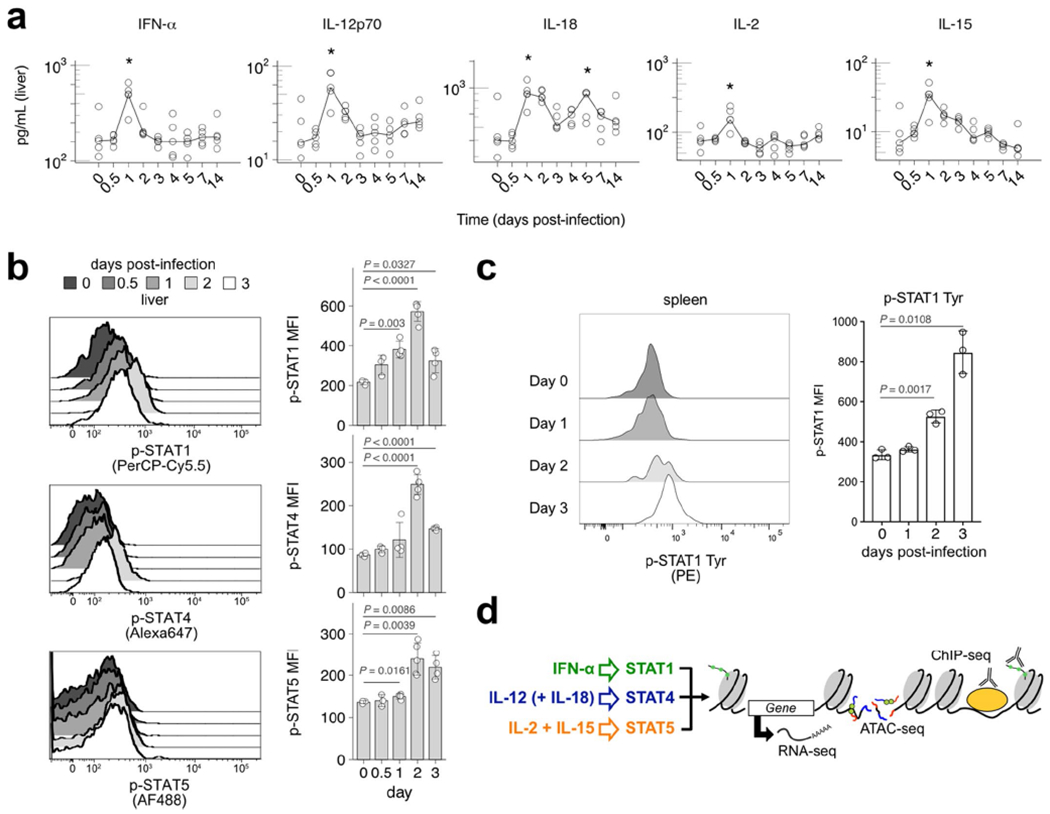
Extended Data Fig. 1 |. Cytokines peak early during MCMV infection.

Livers and spleen were harvested at days 0, 0.5, 1, 2, 3, 4, 5, 7 and 14 after MCMV infection. Organs were lysed for protein extracts, and then measured for cytokine levels. Plots show cytokine levels of IFN-α, IL-12p70, IL-18, IL-2, and IL-15 over time. For (a), n = 5, and for (b-c), n = 3-5. a, Plots show cytokine levels in the liver of IFN-α, IL-12p70, IL-18, IL-2, and IL-15 over time, with log10 scale on y-axis. Lines connect at medians of each time point. * p = 0.016-0.032 from two-sided Mann-Whitney-Wilcoxon test comparing to day 0. b, Graphs show mean ± SD of phosphorylated STAT MFI values (p-STAT1 [Ser], p-STAT4, [Tyr] and p-STAT5 [Tyr]) proteins from liver CD3ε− TCRβ− NK1.1+ NK cells. P-values are calculated by two-sided Welch’s t-test. c, Graphs show mean ± SD of p-STAT1 (Tyr) MFI values from spleen CD3ε− TCRβ− NK1.1+ NK cells. P-values are calculated by two-sided Welch’s t-test. d, Schematic of global profiling strategy. MFI = mean fluorescence intensity.
