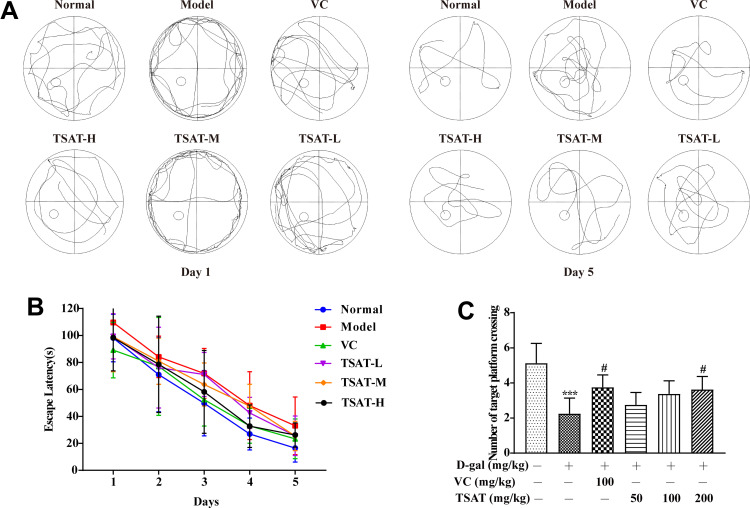
Figure 4.
Morris water maze test. (A) Representative pictures of swimming traces on the 1st day and 5th day in the D-gal model; (B) TSAT treatment reduced escape latency time in the D-gal model. (C) TSAT treatment increased across platform times in the D-gal model. ***p<0.0001 vs. normal group; #p<0.05 vs. model group. The data are presented as the means ± SD (n=8).

