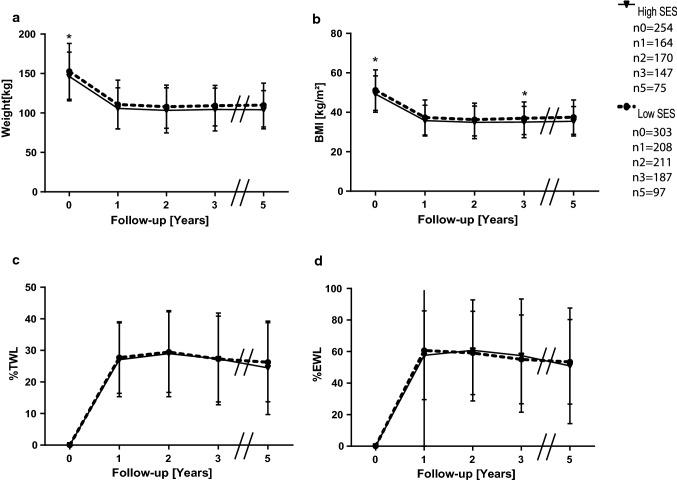
Fig. 2.
Means and standard deviations of weight a, BMI b, %TWL c and %EWL d of the study population over 5 years divided into their respective SES groups. nt is the number of available and analyzed patients, while t is the timepoint in years postoperatively. Follow-up rates for the high SES group were 64.6% after one year, 66.9% after two years, 57.9% after three years and 29.5% five years postoperative, for the low SES group the according rates were 68.6%, 69.6%, 61.7% and 32%. *p < 0.05

