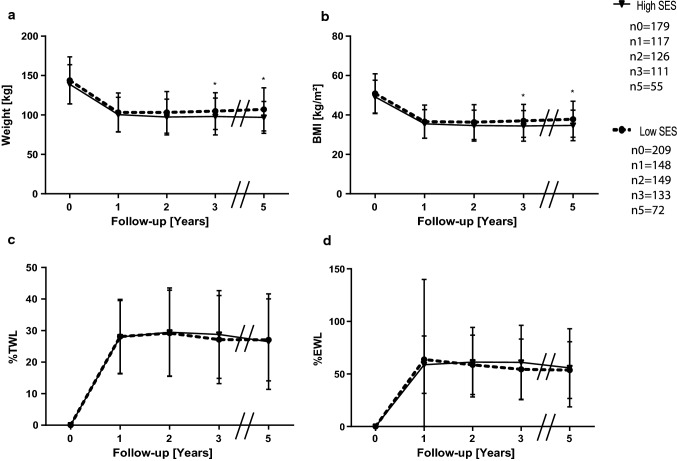
Fig. 4.
Means and standard deviations of weight a, BMI b, %TWL c and %EWL d for women in different SES classes. nt is the number of available and analyzed patients for each group, while t is the timepoint in years postoperatively. Follow-up rates for women in the high SES group were 65.3% after one, 70.3% after two, 62% after three and 30.7% five years postoperative, for the low SES group the according rates were 70.8%, 71.3%, 63.6% and 34.4%. *p < 0.05

