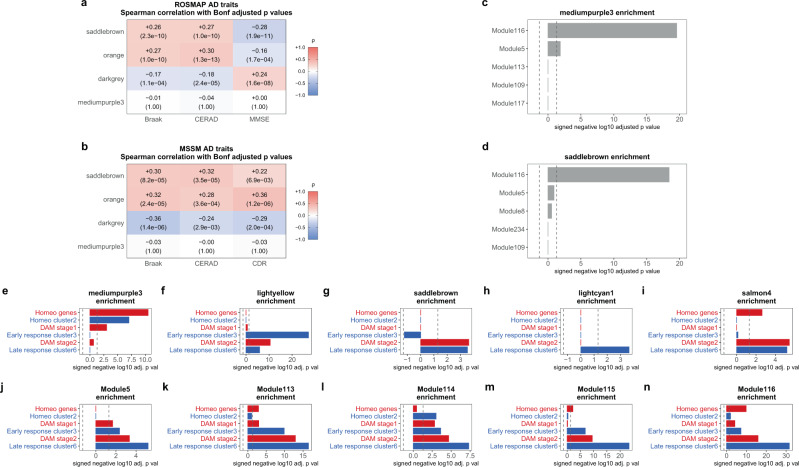
Fig. 5. The modules identified in our NPH data also correlate with AD pathology in autopsy cohorts.
aSaddlebrown, orange, and darkgrey correlate with CERAD score, Braak stage, and MMSE score in 596 RNA-seq profiles from the Religious Orders Study and Memory and Aging Project (ROSMAP) Study (representing a range of AD pathologic states)1. b Similarly, these modules correlate with CERAD, Braak, and CDR score in RNA-seq profiles from frontal cortex in 183 RNA-seq profiles from the MSSM dataset4 (all correlations in a, b are Spearman’s correlations with two-sided significance). c, d Saddlebrown and mediumpurple3 are both primarily enriched for genes from the same microglial module from Mostafavi et al.1, suggesting that microglial genes in our data are correlating differently than in autopsy cohorts (see Supplementary Data 9 for enrichment analysis with two-sided Fisher’s exact test p values of saddlebrown, orange, darkgrey, and mediumpurple3 with all modules from Mostafavi et al.1). e–n The distribution of enrichment for mouse microglial gene lists from Keren-Shaul et al.37 (red bars) and Mathys et al.38 (blue bars) is more segregated in the top five microglial modules from the NPH data (e–i) than in the top five microglial modules from Mostafavi et al.1,39 (j–n) (see text for details and discussion and Supplementary Data 8–10 for all Spearman’s correlations and two-sided Fisher’s exact test enrichment p values from these panels). For a, b, each row is separately Bonferroni adjusted, with adjusted p values in parentheses below Spearman’s correlations; for two-sided Fisher’s exact test in c–n, each panel is separately Bonferroni adjusted—dotted line in c–n is p value = 0.05.

