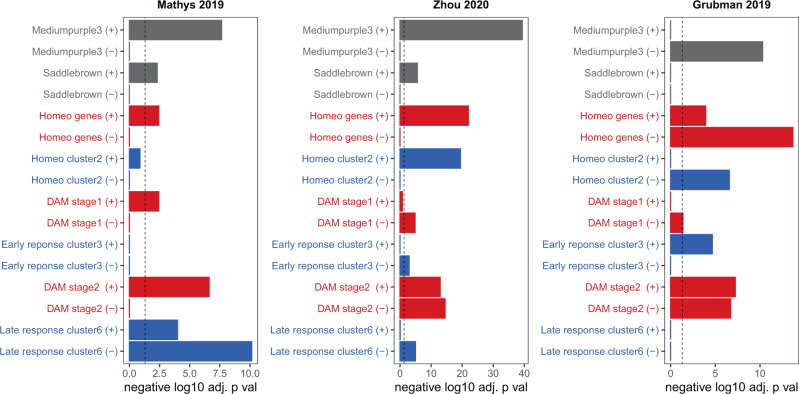
Fig. 6. Human single-nucleus microglial RNA-seq data is enriched for our NPH modules and mouse microglial gene lists.
For each single-nucleus RNA-seq study, microglial genes that increased (+) or decreased (−) in AD were separately analyzed using two-sided Fisher’s exact test for enrichment for gene sets on the y-axis; Supplementary Data 7 has all analyses from this figure. The top two modules in gray (mediumpurple3 and saddlebrown) are NPH modules from this paper; mouse gene lists from Keren-Shaul et al.37 (red) and Mathys et al.38 (blue) are also shown. Mathys et al.21 and Zhou et al.19 both show enrichment for lists in the microglial gene set that is increasing in AD, although in both datasets there are some DAM or late-stage gene that are decreasing in AD. Similar to the first two studies, Grubman et al.22 also shows a mixed response for DAM genes. Unlike the first two studies, Grubman et al. shows significant overlap of homeostatic gene sets with microglial genes that are decreasing in AD. See main text for discussion. Each study is separately Bonferroni adjusted—dotted line in all panels is p value = 0.05.

