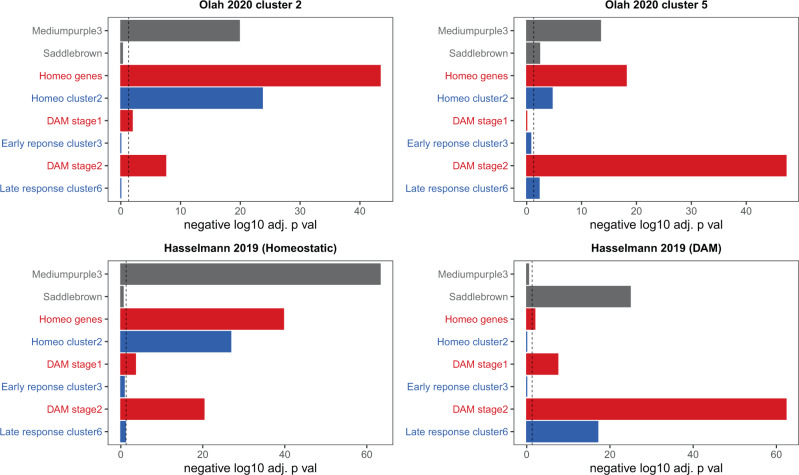
Fig. 7. Human single-cell microglial RNA-seq data is enriched for our NPH modules and mouse microglial gene lists.
Clusters 2 and 5 are from single-cell sequencing of microglia from autopsy tissue (Olah et al.20) and the homeostatic and DAM cluster defining genes from Hasselmann et al.43 are from a xenograph mouse model (see text for details). In each panel, the top two modules in gray (mediumpurple3 and saddlebrown) are NPH modules from this paper; mouse gene lists from Keren-Shaul et al.37 (red) and Mathys et al.38 (blue) are also shown. Cluster 2 from Olah et al. is the cluster from this paper most enriched for homeostatic genes from the mouse literature, and cluster 5 is most enriched for DAM stage 2 genes. Nevertheless, both clusters are also enriched for genes from opposing gene lists (i.e., cluster 2 is enriched for DAM stage 2 genes and cluster 5 is enriched for homeostatic genes), and both are enriched for mediumpurple3. The homeostatic and DAM xenograph clusters are enriched exclusively for mediumpurple3 and saddlebrown, although even here there is some crossover enrichment with mouse lists (i.e., DAM stage 2 gene enrichment with the homeostatic cluster). See main text for discussion and Supplementary Data 7 for all analyses with these datasets, including the analysis displayed in this figure. Each analysis in this figure uses a two-sided Fisher’s exact test and is separately Bonferroni adjusted—dotted line in all panels is p value = 0.05.

