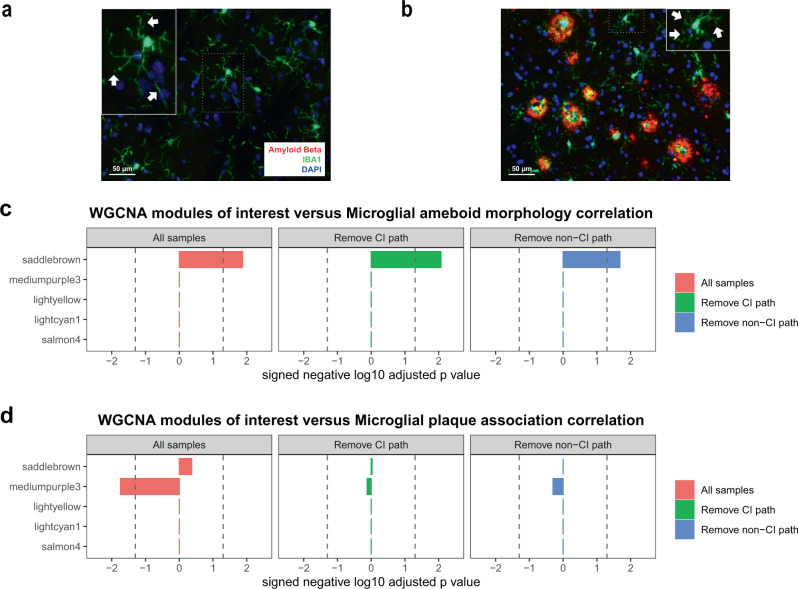
Fig. 8. Our microglial modules correlate with microglial morphology and location.
We performed β-amyloid/IBA-1 dual staining on selected cases from our cohort. a Cases without β-amyloid showed microglia with longer processes (white arrow; microglial cell in inset is blow-up from area demarcated with dotted line), while b cases with β-amyloid pathology tended to show more ameboid, activated microglia. We stained 59 biopsies for β-amyloid/IBA-1 and this data is used to calculate correlations in c, d. As noted in the “Results” section, microglial ameboid morphology moderately correlated with plaque area in the same biopsy (r = 0.3; two-sided p value = 0.01; ameboid morphology was measured using the compactness metric in Cellprofiler—see “Methods” for details). c, d We assessed the Spearman’s correlation with two-sided significance of the top five microglial modules shown in Fig. 5e–i for microglial ameboid morphology (measured using the compactness metric in Cellprofiler—see “Methods” for details) (c) and microglial β-amyloid plaque association (d). Only saddlebrown significantly correlates with microglial ameboid morphology, and this is seen whether or not samples with AD pathology come from patients who report cognitive symptoms (the green and blue bars represent groups formed using the same methodology as in Fig. 3a, b). In addition, only the mediumpurple3 module significantly (and negatively) correlates with microglial plaque association, suggesting that plaque association correlates with loss of homeostatic genes. When we eliminate samples with AD pathology based on cognitive status, we lose significance for mediumpurple3, which suggests that this correlation is somewhat weak in this dataset, and also that both sample groups are likely contributing to the overall significance of this finding in the full dataset. In c, n = 59 for all samples (red bars), n = 35 in the Remove CI path group (green bars), and n = 42 in the Remove non-CI path group (blue bars); in d, n = 29 for all samples, 11 in the Remove CI path group (green bars), and n = 18 in the Remove non-CI path group (blue bars). The three panels in c and the three panels in d are each separately Bonferroni adjusted—dotted line in all panels is p value = 0.05; see Supplementary Data 12 for all Spearman’s correlations, p values, and adjusted p values from this figure.

