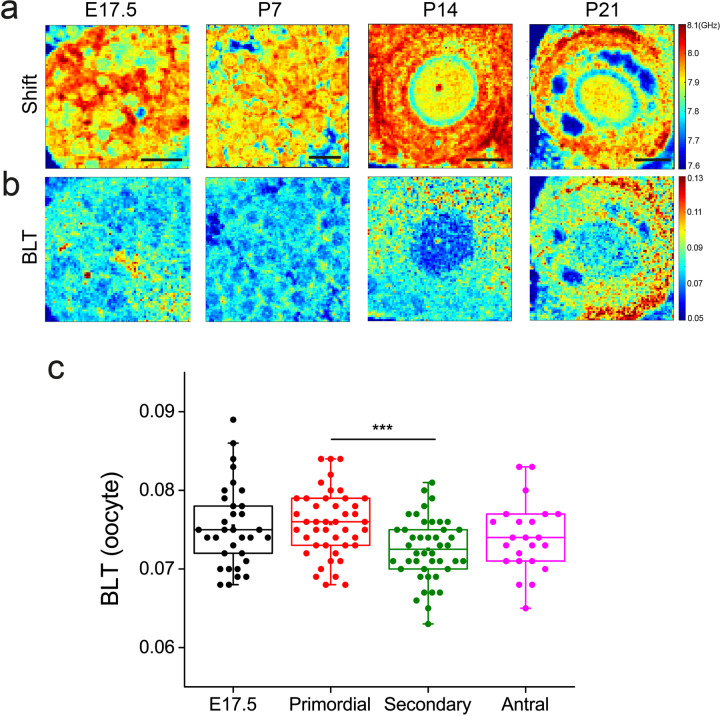
Fig. 4. Ooplasm exhibits more liquid-like behavior at the early stages of oogenesis.
a Row shows representative maps of Brillouin shift for oocytes from fetal ovaries (E17.5), primordial follicles (P7), secondary follicle (P14) and antral follicle (P21) ovaries. Scale bar = 40 μm. Blue regions within the antral follicle (P21) indicate fluid lumena. b Corresponding Brillouin loss tangent for a. c Boxplot of BLT for oocytes at various stages of follicle development. Each data point corresponds to the average signal of one oocyte. N = 35, 45, 45, 21 for E17.5 germ cells and oocytes from primordial, secondary, and antral follicle stage, respectively. ***P < 0.001.

