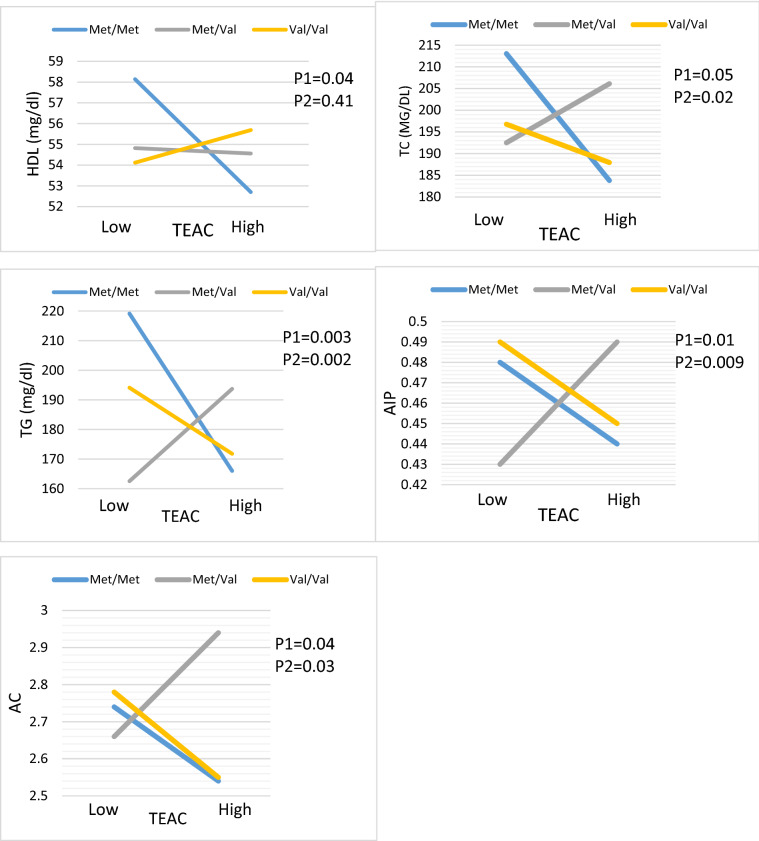
Figure 3.
Interaction between the BDNF Val66Met polymorphism and DTAC (TEAC) intake with regard to TG, HDL, AIP and AC according to the median DTAC, the participants were dichotomized into low and high categories. P 1 = P value with unadjusted (crude) model, P 2 = P value with adjustments for potential confounding factors including (Age, physical activity, sex, smoking, alcohol, energy intake, lipid, and glucose-lowering medicines, and family history of diabetes).

