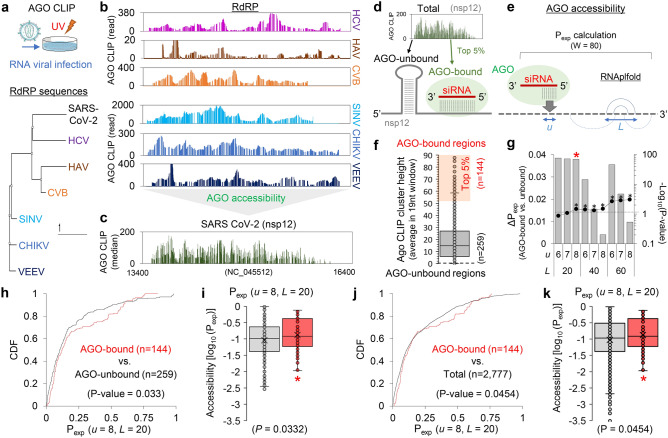
Figure 1.
Meta-analyses of AGO CLIP data for SARS-CoV-2 and resultant determination of parameters for calculating AGO accessible regions. (a) AGO CLIP analyses derived from various RNA viral infections (upper panel), where published data29 from standard AGO CLIP were retrieved. Six RNA viruses were selected as related to SARS-CoV-2 based on phylogenic analyses of RdRP sequences (lower panel). Details in the Material and methods section, providing accession numbers in the GEO database. (b) AGO-bound regions in the RdRP of the six RNA viruses related to SARS-CoV-2, aligned on the counterpart region of the nsp12 in SARS-CoV-2; HCV, HAV, and CVB (b, upper panel) and SINV, CHIKV, and VEEV (b, lower panel) (c) Consensus AGO CLIP reads on the nsp12 of SARS-CoV-2 (NC_045512), delineated from the meta-analysis. Compiled AGO CLIP reads (median of read-counts at each position) are presented to estimate putative AGO binding in the nsp12 region of SARS-CoV-2, inferred from the six RNA viruses29. (d,e) Schematics for predicting AGO accessibility; AGO-bound (top 5%) and AGO-unbound (no CLIP reads) regions presumably caused by RNA secondary structure (d); calculation of AGO accessibility (Pexp; exposure probability) using the previously defined window size (80 nucleotides; W = 80) under the parameters31, length of a region for accessibility (u) and range of nucleotides allowing local base pairing (L). (f) Ranking of the inferred AGO-accessible sites in nsp12. A set of high confident AGO-bound regions (high AGO accessibility) was defined by selecting the top 5% of compiled AGO CLIP clusters depending on their heights (average read-count in the 19 nucleotides window; n = 144, orange shade). AGO-unbound regions were selected as the sites with no AGO CLIP reads across the selected RNA viruses (HCV, HAV, CVB, SINK, CHIKV, and VEEV) or where AGO CLIP reads were observed in only one RNA virus species (biological complexity = 1; n = 259). (g) The partition function for all local structures within the window (80 nucleotides) was calculated to derive the exposure probability (Pexp) with RNAplfold31. The difference in Pexp between the AGO-bound regions and AGO-unbound regions in nsp12 was calculated (ΔPexp, bar graph); significance, − log10 (P-value), line graph; dotted-line, P = 0.05; P-value, Wilcoxon rank-sum test (two-sided). (h) Cumulative distribution function (CDF) analyses of Pexp under the optimised parameter (u = 8, L = 20) for the AGO-bound vs. AGO-unbound regions; P-values from Kolmogorov–Smirnov test (two-sided). (i) Accessibility of the target sites (log10(Pexp)) was also calculated for the AGO-bound (red box plot) vs. AGO-unbound regions (grey box plot); *P < 0.05, Wilcoxon rank-sum test (two-sided). (j,k) Same CDF analyses (h) performed in (f) and box plot analyses (i) performed in (g) except that the AGO-bound regions were compared with the total regions in nsp12.

