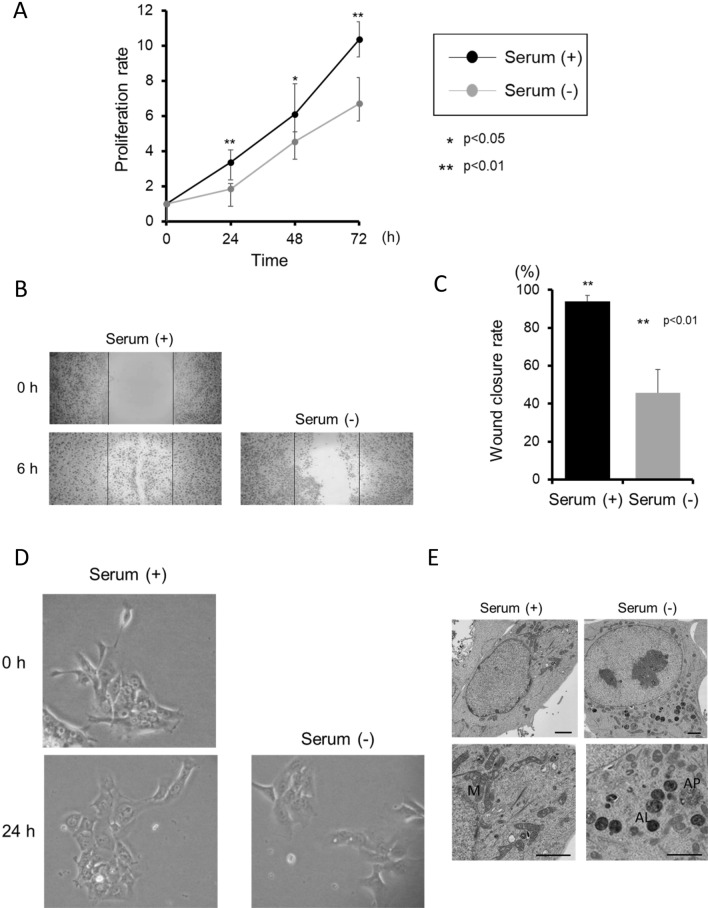
Figure 1.
Effects of serum starvation on the biological activity of HNSCC SAS cells. (A) Growth of SAS cells as measured by MTT assay after treatment for the indicated time, with or without serum. The data are shown as mean ± SD of 3 independent experiments and analyzed by t-test. (B,C) Migration assay in cells treated with/without serum. The bars show the area of scratches at 0 h. The rates of wound closure were determined from the assays and indicate the mean ± SD of 3 independent experiments. (D) The cell morphology was photographed with a phase contrast microscope. (E) TEM examination of SAS incubated for 24 h with/without serum. The bar markers represent 2 μm. M: mitochondria, AP: autophagosome, AL: autolysosome.

