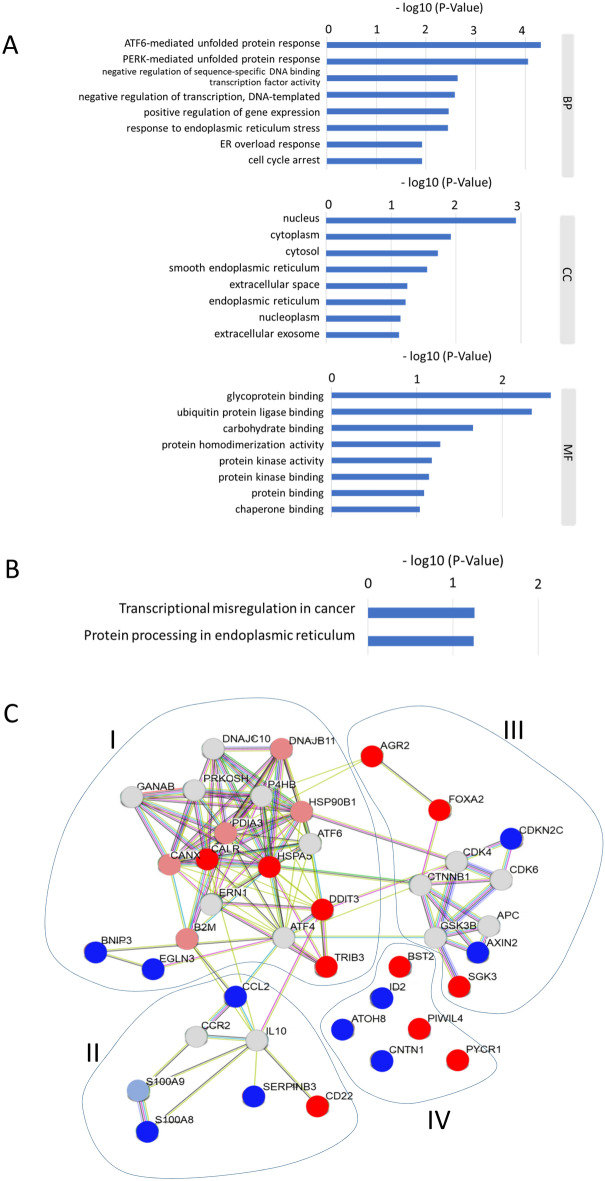
Figure 3.
Function and protein–protein interaction analysis of SIGs. (A) A list of the top 8 significant GO terms determined by GO enrichment analysis of 21 selected genes. BP, biological process; CC, cellular composition; MF, molecular function. (B) List of molecular pathways determined by KEGG pathway enrichment analysis of 21 selected genes. (C) Proteins encoded by 21 genes extracted using 7 keywords were subjected to PPI network analysis. Up-regulated genes are shown in red. Down-regulation is shown in blue, and gray indicates genes whose expression did not change under serum starvation.

