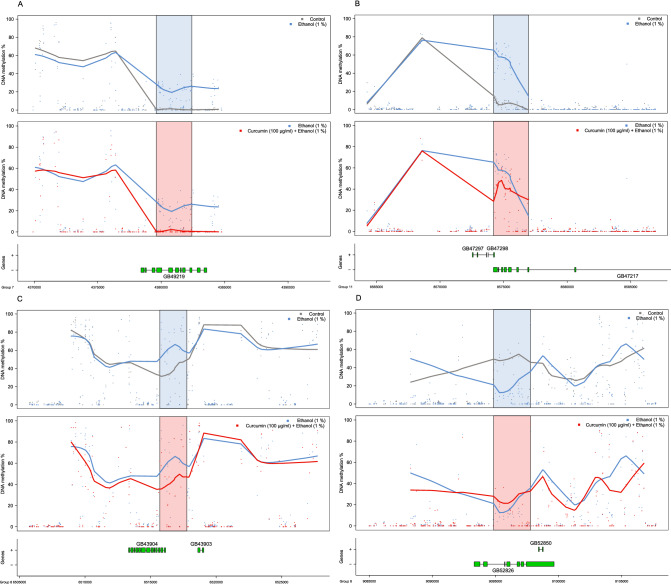
Figure 3.
(A–D) Differentially methylated regions where the top panel depicts the situation in control (grey) versus ethanol (blue) fed honey bees, and the blue shaded area indicates the significant DMR. 10 kbp upstream and downstream (if no gaps exist in the Amel 4.5 genome build) are plotted for reference (white background). The middle panel depicts the comparison between ethanol-only (blue) and the honey bee group fed ethanol and curcumin (red). The lower panels depict the gene structure by exons (boxes) and introns (lines) by strand according to linkage groups.

