
Figure 2.
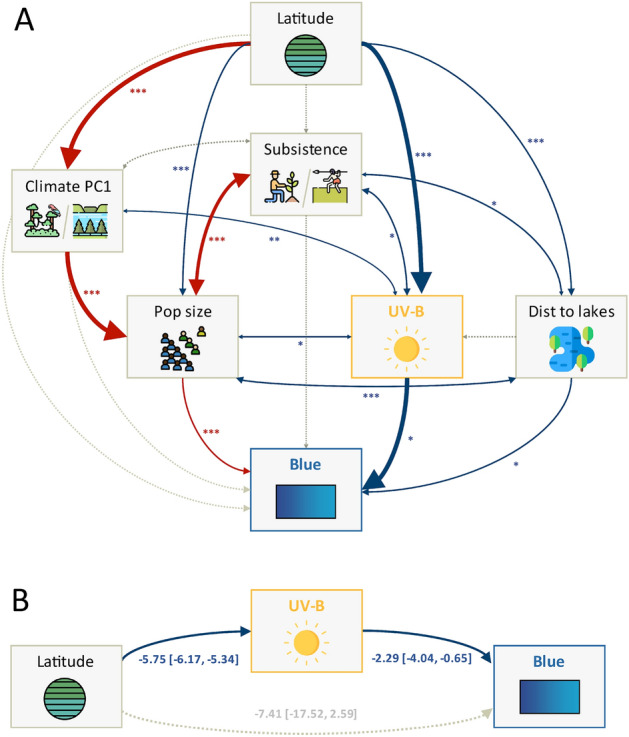
Mediation and path analyses for the presence of a distinct word for blue. (Panel A top): Path model with standardized coefficients (line thickness) and p-values (stars). Single-headed arrows represent regressions, while double-headed arrows represent covariances. Edges: solid blue = significant negative effects (at alpha-level 0.05), solid red = significant positive effects, and dotted gray = not significant. The thickness of the line indicates effect size, with a thick line indicating an effect size and thin effect size ; significance stars near each arrow (*** for ; ** for and * for ). (Panel B bottom): Mediation analysis showing the total, direct, and indirect effects (as point estimate with 95% HDI and p-values), as well as regression coefficients (as point estimates with p-values in parentheses). Note, because the outcome is binary, the direct and indirect effects may be on different scales. Icons made by Freepik https://www.freepik.com from Flaticon https://www.flaticon.com/.