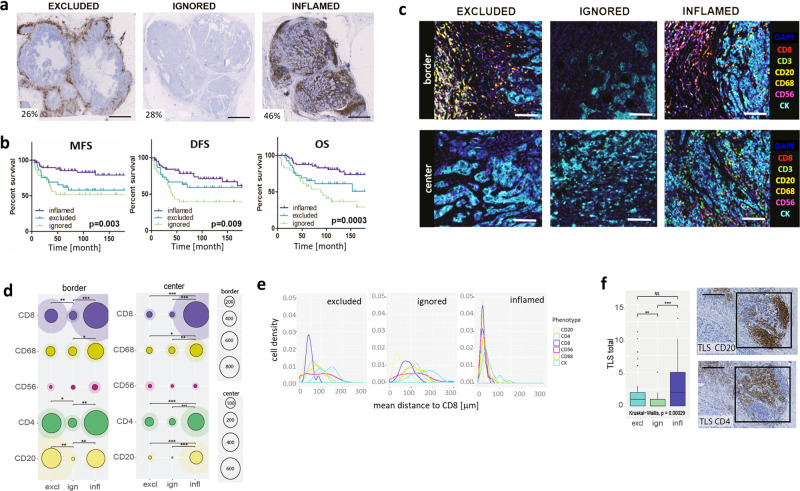
Fig. 1. Spatial immune contexture is prognostic in TNBC.
a, b Representative whole slide images of CD8+ T cell spatial phenotypes with the percentage of patients per phenotype (scalebar corresponds to 5 mm) (A) and corresponding Kaplan–Meier curves for metastasis-free survival (MFS), disease-free survival (DFS), and overall survival (OS) (B, p values show two-sided log-rank test; time is displayed in months, n = 122 LNN TNBC, of which n = 32 excluded, n = 27 ignored, and n = 61 inflamed). c Representative multiplex IF images of immune effector cells at the tumor border and center of each spatial phenotype (CD8+: red, CD3+: green, CD20+:yellow, CD68+: orange, CD56+: magenta, CK:cyan, DAPI: blue; scalebar corresponds to 50 μm). d Circle plots show mean and SD of immune cell densities (cells/mm2) at border and center for CD8+ (purple), CD68+ (dark yellow), CD56+ (magenta), CD4+ (green), CD20+ (pale yellow), (n = 64 LNN TNBC, of which n = 18 excluded, n = 19 ignored, and n = 27 inflamed). e Histograms show mean distances in μm between CD8+ T cells and CD8+ (purple), CD68+ (dark yellow), CD56+ (magenta), CD4+ (green), CD20+ (pale yellow) CK+ (cyan) cells (x-axis) versus cell densities (cells/mm2, y-axis). f Boxplots show median with 25th–75th percentile, range, and outliers displayed as dots of the total number of tertiary lymphoid structures (TLS, identified by consecutive stainings of CD20+ B cells (top) and CD4+ T cells (bottom), see black squares in images, scalebar corresponds to 100 μm; n = 134 LNN TNBC, of which n = 32 excluded, n = 21 ignored, and n = 61 inflamed). Significant differences are: ***p < 0.001; **p < 0.01; *p < 0.05, NS, p > 0.5 (Kruskal–Wallis, one-sided). Source data are provided within the source data file.

