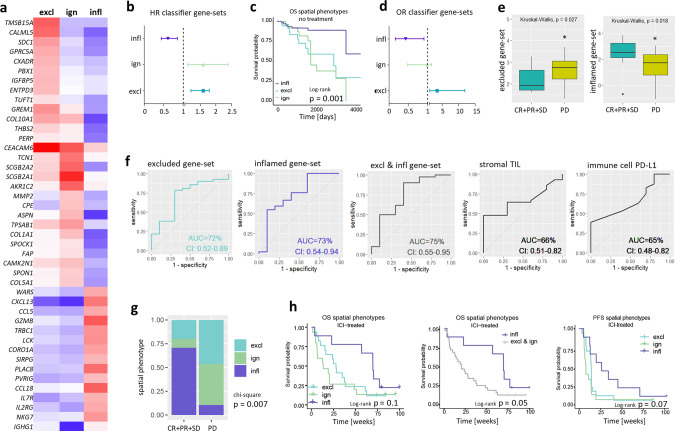
Fig. 2. Gene classifier assigns spatial phenotypes of CD8+ T cells and stratifies metastasized TNBC patients according to ICI response.
a Heatmap showing median expression of classifier genes per spatial phenotype in the discovery set (red: high expression, blue: low expression; Cohort A1, n = 101 TNBC). b Forestplots showing HRs and CIs (error bars) of classifier gene-sets (Cohort B, n = 196 basal-like BC). c Kaplan–Meier curves of assigned spatial phenotypes in primary TNBC patients (Cohort E, n = 137 TNBC, p-value shows two-sided log-rank test). d Forestplots showing Odds Ratios (OR) and CIs (error bars) for response to anti-PD-1 treatment of classifier gene-sets (Cohort D, TONIC trial, n = 53 metastatic TNBC). e Boxplots displaying the median with 25th–75th percentile and range (outliers are displayed as dots) of the average expression of classifier gene-sets in responding (CR + PR + SD > 24 weeks) and nonresponding (PD) patients (Cohort D, n = 53 metastatic TNBC, of which n = 10 CR + PR + PD, and n = 43 PD). f ROC curves predicting clinical response (PR + CR + SD) with areas under the curve (AUC) and CIs for gene sets of excluded-, inflamed- or a combination of the two phenotypes (average expression of respective gene-sets was used) (first three panels), or for standardly used predictive markers, such as frequency of stromal TILs and PDL1 positivity of immune cells (Cohort D) (last two panels). g Proportions of assigned spatial phenotypes (excluded: cyan, ignored: green and inflamed: purple) in patients with metastatic TNBC responding or not responding to anti-PD-1 treatment (pretreatment biopsies, n = 51) and h corresponding survival curves (Cohort D, p value shows two-sided log-rank test). Source data are provided within the source data file or can be retrieved under controlled access (see ref. 8 for details).

