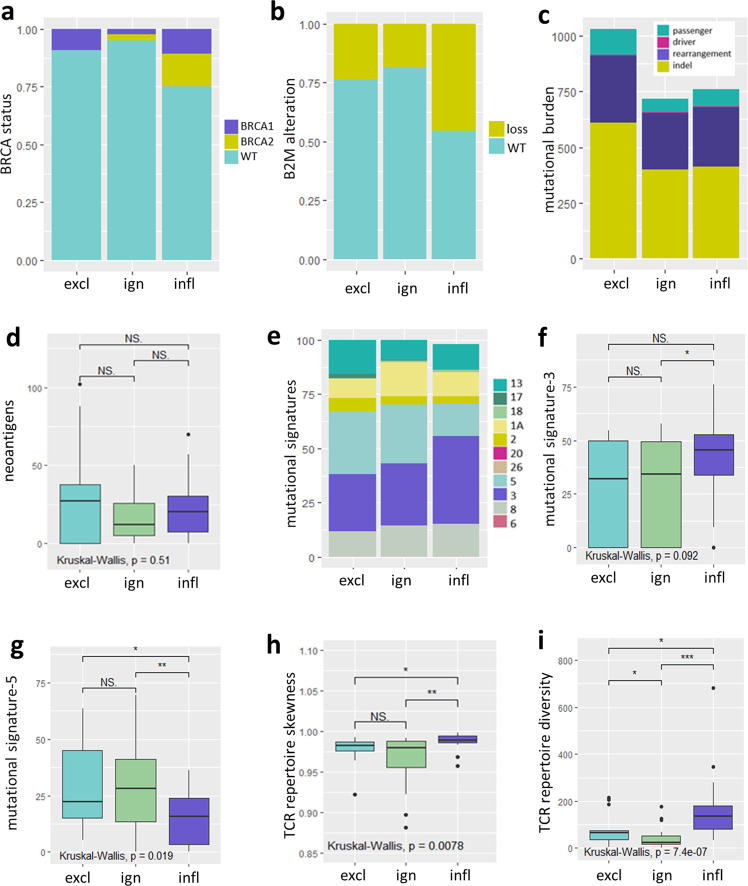
Fig. 3. Genomic features of spatial phenotypes.
The following parameters were tested for differential presence in spatial phenotypes (determined by the gene-classifier) in TNBC: a BRCA status (proportion, BRCA1: purple, BRCA2: yellow, WT: cyan). b Loss of β2-microglobin (copy number, B2M-loss: yellow, B2M-wt: cyan). c Total number of different types of mutations (passenger mutations: cyan, driver mutations: magenta, structural rearrangements: purple, indels: yellow). d Total number of predicted neo-antigens. e Proportions of most abundant mutational signatures. f, g Frequencies of signatures-3 and 5. h TCR repertoire skewness (based on the gini-simpson index). i Total number of different TCR-Vβ reads. For all above parameters Cohort C (n = 66 TNBC, comprising n = 13 excluded, n = 29 ignored, and n = 24 inflamed) was used, spatial phenotypes were assigned according to the classifier. All boxplots display the median with 25th–75th percentile, range, and outliers are displayed as dots. Significant differences are: ***p < 0.001; **p < 0.01; *p < 0.05, NS, p > 0.5 (Kruskal–Wallis, one-sided). Source data are provided within the source data file.

