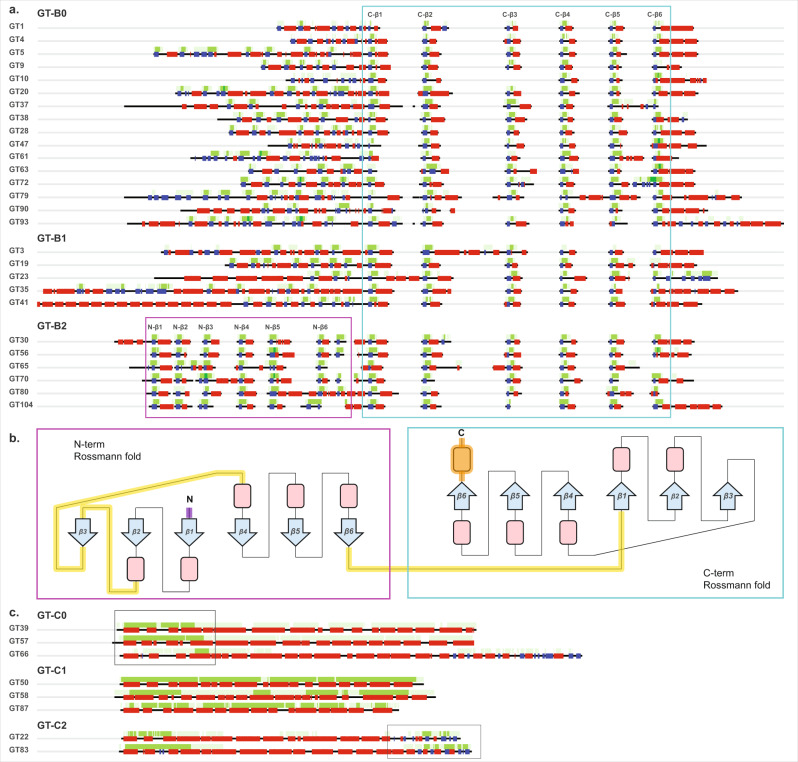
Fig. 4. CAM maps for the different GT-B and GT-C fold clusters highlight their respective conserved cores.
a Consensus secondary structure (blue: beta-sheets; red: helices; green: loops) and average CAM values (higher intensity of green corresponds to a higher CAM value) from layer 2 are shown for all families belonging to the three GT-B fold clusters. These average values were generated from sequence alignments within each family. High CAM values within the cyan box point to the C-terminal Rossmann fold conserved across all GT-B fold members and the magenta box points to the N-terminal Rossmann fold conserved in GT-B2. b A topological representation of the conserved features of GT-B. The conserved C-terminal Rossmann-like fold region is shown in the cyan box. The N-terminal Rossmann fold, which is most conserved in members of GT-B2 cluster is shown in the magenta box. Conserved beta-sheets are shown as blue arrows with labels, and alpha-helices are shown as red boxes. Loop regions that have the most variability across families are indicated by yellow lines. Purple N-terminal loop and orange C-terminal helix indicate the presence of variable secondary structures preceding the N-terminal and following the C-terminal Rossmann fold, respectively. c Consensus secondary structure and average CAM values from layer 3 for GT-C families from clusters GT-C0, GT-C1, and GT-C2. Boxes indicate regions with higher average layer 3 CAM values for GT-C0 and GT-C2 in the N-terminal and the C-terminal regions, respectively. For GT-C1, layer 3 CAM is high throughout the full length of the sequences. Source data are provided as a Source Data file.

