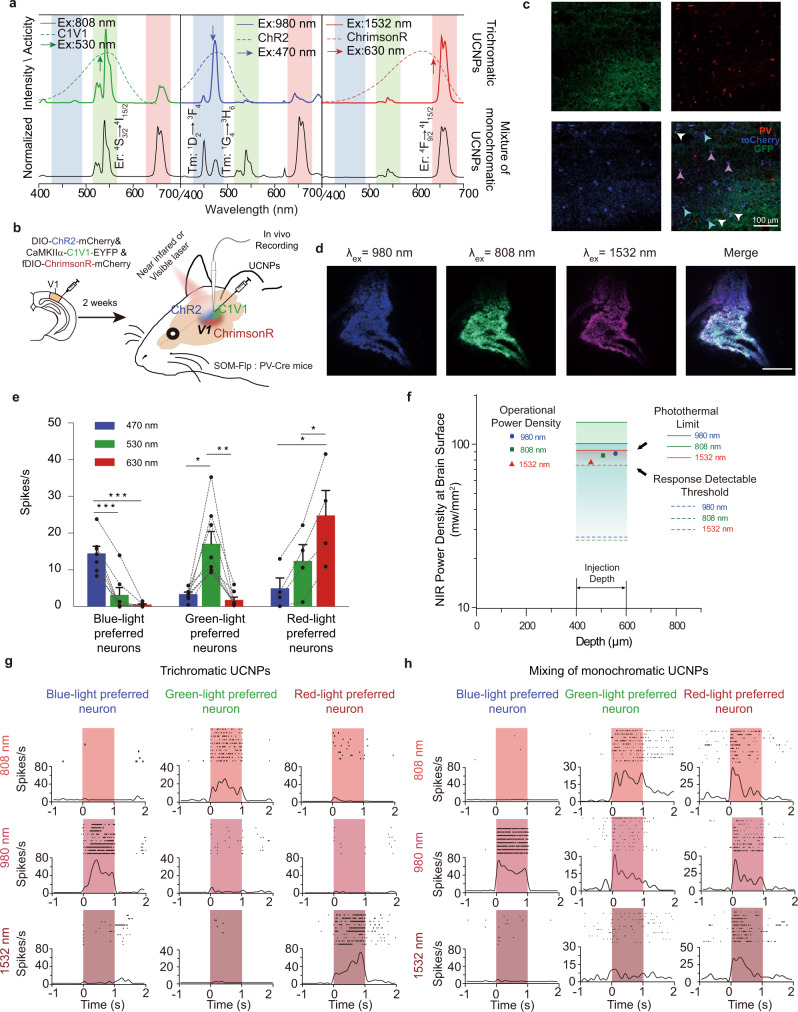
Fig. 4. Trichromatic UCNPs-mediated in vivo optogenetic activation of three distinct neuronal populations.
a Emission spectra of trichromatic UCNPs (colored full line) and a mixture of three monochromatic UCNPs (black full line) under 808, 980, and 1532 nm NIR and activated spectra of three optogenetic proteins (dash line)5, 28 (C1V1, ChR2, and ChrimsonR). Ex excitation wavelength. Power density is set at 20 mW/mm2. Arrows indicate the wavelengths of the visible light lasers. b Schematic showing upconversion manipulated multicolor optogenetic experiment. The three viruses were injected into the primary visual cortex (V1) of somatostatin (SOM)-Flp:parvalbumin (PV)-Cre mice. UCNPs were injected into the same sites 2 weeks later and in vivo electrophysiology recordings were conducted in V1 thereafter. c Expression of C1V1-EYFP, ChrimsonR-mCherry, and ChR2-mCherry in CaMKIIα, PV, and SOM neurons respectively. PV neurons were labeled with PV-antibodies to distinguish ChR2-expressing PV neurons from ChrimsonR-expressing SOM neurons. White arrows indicate EYFP-expressing CaMKIIα neurons, light blue arrows indicate mCherry-expressing SOM neurons, and pink arrows indicate mCherry-expressing PV neurons. Scale bar, 100 μm. Immunohistochemistry was repeated four times with similar results observed. d Distribution of trichromatic UCNPs in V1. Fluorescent images were taken under 1532, 808, and 980 nm excitations. Scale bar, 200 μm. This experiment was repeated five times and similar results were observed. e Selectivity of opsins with 470, 530, and 630 nm laser excitation (0.44 mW/mm2 for 470 nm, 0.70 mW/mm2 for 530 nm, and 0.83 mW/mm2 for 650 nm at the brain surface; 0.06 mW/mm2 for 470 nm, 0.08 mW/mm2 for 530 nm, and 0.14 mW/mm2 for 650 nm at 400 μm depth, 1 s pulse width, 0.1 Hz, nblue-light preferred neurons = 7 neurons in three mice, ngreen-light preferred neurons = 8 neurons in two mice, nred-light preferred neurons = 4 neurons in three mice, *P < 0.05; **P < 0.01; ***P < 0.001, one-way repeated-measures Analysis of variance (ANOVA) with Tukey’s multiple comparison test). The exact p values are listed in Supplementary Table 3 in the supplementary information. f Calculated allowable range of NIR power density at the brain surface. The operational power density is allowed for chromatic selectivity of optogenetic proteins and thermal limit as well as detecting the activation response. The operational NIR power densities are used in the electrophysiology experiment. g Representative optogenetic responses in blue-light preferred (left), green-light preferred (middle), and red-light preferred neurons stimulated by NIR light with trichromatic UCNPs at 980, 808, and 1532 nm, respectively (89.1 mW/mm2 for 980 nm, 86.4 mW/mm2 for 808 nm, and 76.8 mW/mm2 for 1532 nm at brain surface; 22.8 mW/mm2 for 980 nm, 15.3 mW/mm2 for 808 nm, and 20.2 mW/mm2 at 400 μm depth, 1 s pulse width, 0.05 Hz). The low spontaneous firing rate was due to a relatively deep anesthesia state). h Same as in (g) but for a mixture of three monochromatic UCNPs. Source data are provided as a Source Data file.

