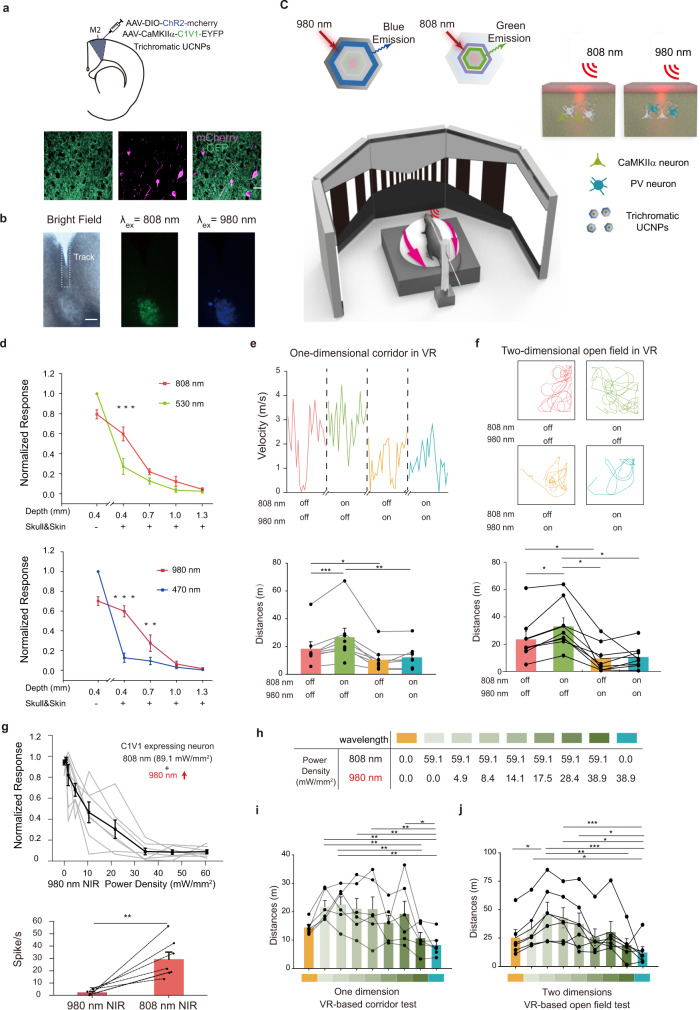
Fig. 5. Transcranial optogenetic gradient multicolor manipulation of mouse locomotion behavior using UCNPs.
a Schematic showing the stereotaxic injection of AAV-DIO-ChR2-mCherry, AAV-CaMKIIα-C1V1-EYFP viruses, and UCNPs in M2 (top) and corresponding fluorescence image showing the expression of ChR2-mCherry and C1V1-EYFP in PV and CaMKIIα neurons, respectively in M2. Scale bar, 50 μm. b Distribution of trichromatic UCNPs in M2. Fluorescent images were taken under 808 or 980 nm excitation. Scale bar, 200 μm. Immunohistochemistry was repeated twice and similar results were observed. c Schematic illustrations of head-fixed PV-Cre mouse running in VR System. NIR laser (four conditions: none, 808, 980 nm, or both) was transcranially illuminated onto M2 for 120 s (100 ms pulse width, 5 Hz). d Neuronal responses of visible laser (530, 470 nm, 1 s pulse width, 0.1 Hz) and NIR laser (808, 980 nm, 1 s pulse width, 0.05 Hz) with skull, skin, and different thicknesses of brain tissue on the top (n808nm = 4 neurons in two mice, n980nm = 6 neurons in two mice, **P < 0.01, ***P < 0.001, one-way repeated-measures ANOVA with Tukey’s multiple comparison test). e Running speed of one mouse in a one-dimensional corridor in VR system under 808 and 980 nm NIR excitations and the corresponding normalized average running distances (n = 8 mice, three trials for each mouse, *P < 0.05, **P < 0.01, ***P < 0.001; two-way repeated-measures ANOVA with Tukey’s multiple comparison test). f Traces of locomotion movement in a two-dimensional open field in VR system under 808 and 980 nm NIR excitations and the corresponding normalized average running distances (n = 8 mice, three trials for each mouse, *P < 0.05; two-way repeated-measures ANOVA with Tukey’s multiple comparison test). g (Top) Normalized CaMKIIα neurons’ responses (n = 7 neurons in four mice) evoked by 808 nm laser (power density = 86.4 mW/mm2 at brain surface, 1 s pulse width, 0.05 Hz) together with an increasing power density of 980 nm laser (power density from 0 to 38.9 mW/mm2 at brain surface, 1 s pulse width, 0.05 Hz), gray lines represent responses of each C1V1-expressing neuron, respectively. (Bottom) Responses of recorded neurons under 980 and 808 nm NIR (**P = 0.005, two side paired t-test). h Power densities for different conditions were shown in terms of color. i Normalized running distances of mice (n = 6 mice, three trials for each mouse) in a one-dimensional corridor in a VR system. (*P < 0.05, **P < 0.01; two-way repeated-measures ANOVA with Tukey’s multiple comparison test). j Normalized running distances of mice (n = 6 mice, three trials for each mouse) in a two-dimensional open field in a VR system. (*P < 0.05, **P < 0.01, ***P < 0.001; two-way repeated-measures ANOVA with Tukey’s multiple comparison test). The exact p values are listed in Supplementary Table 3. Data were presented as mean ± s.e.m. Source data are provided as a Source Data file.

